I’m super excited to announce that last Thursday, at an event hosted by the Center for Nonproliferation Studies at the Monterey Institute for International Study, I officially launched NUKEMAP2 and NUKEMAP3D. I gave a little talk, which I managed to record, but I haven’t had the time (more details below on why!) to get that up on YouTube yet. Soon, though.
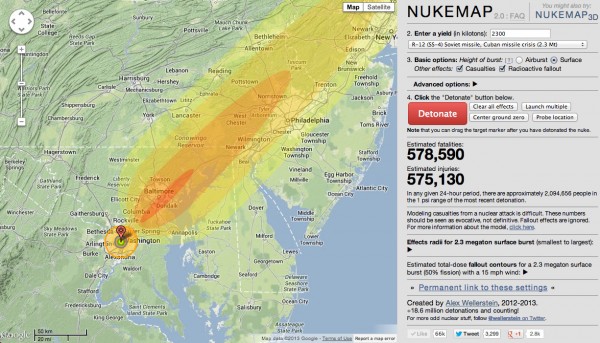
A Soviet weapon from the Cuban Missile Crisis, centered on Washington, DC, with fallout and casualties shown.
NUKEMAP2 is an upgraded version of the original NUKEMAP, with completely re-written effects simulations codes that allow one a huge amount of flexibility in the nuclear detonation one is trying to model. It also allows fallout mapping and casualty counts, among other things. I wanted to make it so that the NUKEMAP went well beyond any other nuclear mapping tools on the web — I wanted it to be a tool that both the layman and the wonk could use, a tool that rewarded exploration, and a tool that, despite the limitations of a 2D visualization, could work to deeply impress people with the power of a nuclear explosion.
The codes that underly the model are all taken from Cold War effects models. At some point, once it has been better documented than it is now, I’ll probably release the effects library I’ve written under an open license. I don’t think there’s anything quite like it out there at the moment available for the general public. For the curious, there are more details about the models and their sources here.
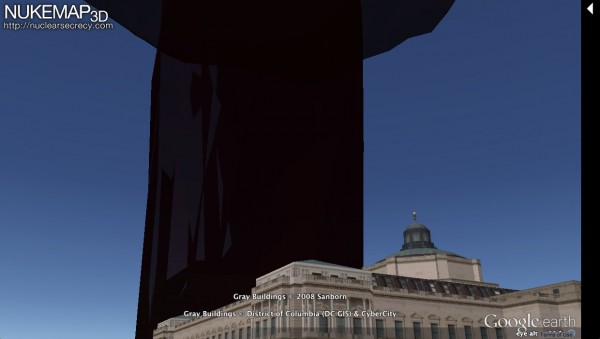
The mushroom cloud from a 20 kiloton detonation, centered on downtown DC, as viewed from one of my common stomping grounds, the Library of Congress.
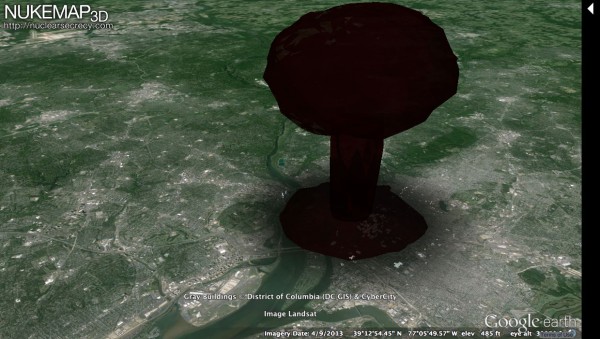
NUKEMAP3D uses Google Earth to allow “3D” renderings of mushroom clouds and the nuclear fireball. Now, for the first time, you can visualize what a mushroom cloud from a given yield might look like on any city in the world, viewed from any vantage-point you can imagine. I feel like it is safe to say that there has never been a nuclear visualization tool of quite this nature before.
I got the idea for NUKEMAP3D while looking into a story for the Atlantic on a rare photo of the Hiroshima mushroom cloud. One of the issues I was asked about was how long after the detonation the photograph was taken — the label on the back of the photograph said 30 minutes, but there was some doubt. In the process of looking into this, I started to dig around the literature on mushroom cloud formation and the height of the Hiroshima cloud at various time intervals. I realized that I had no sense for what “20,000 feet” meant in terms of a cloud, so I used Google Earth to model a simple 20,000 foot column above the modern-day city of Hiroshima.
I was stunned at the size of it, when viewed from that perspective — it was so much larger than it even looked in photographs, because the distance that such photographs were taken from makes it very hard to get a sense of scale. I realized that modeling these clouds in a 3D environment might really do something that a 2D model could not. It seems to switch on the part of the brain that judges sizes and areas in a way that a completely flat, top-down overlay does not. The fact that I was surprised and shocked by this, despite the fact that I look at pictures of mushroom clouds probably every day (hey, it’s my job!), indicated to me that this could be a really potent educational tool.
I’m also especially proud of the animated mode, which, if I’m allowed to say, was a huge pain in the neck to program. Even getting a somewhat “realistic”-looking cloud model was a nontrivial thing in Google Earth, because its modeling capabilities are somewhat limited, and because it isn’t really designed to let you manipulate models in a detailed way. It lets you scale model sizes along the three axes, it allows you to rotate them, and it allows you to change their position in 3D space. So I had to come up with ways of manipulating these models in realtime so that they would approximate a semi-realistic view of a nuclear explosion, given these limitations.
It’s obviously not quite as impressive as an actual nuclear explosion (but what is?), and my inability to use light as a real property (as you could in a “real” 3D modeling program) diminishes things a bit (that is, I can’t make it blinding, and I can’t make it cast shadows), but as a first go-around I think it is still a pretty good Google Earth hack. And presumably Google Earth, or similar tools, will only get better and more powerful in the future.
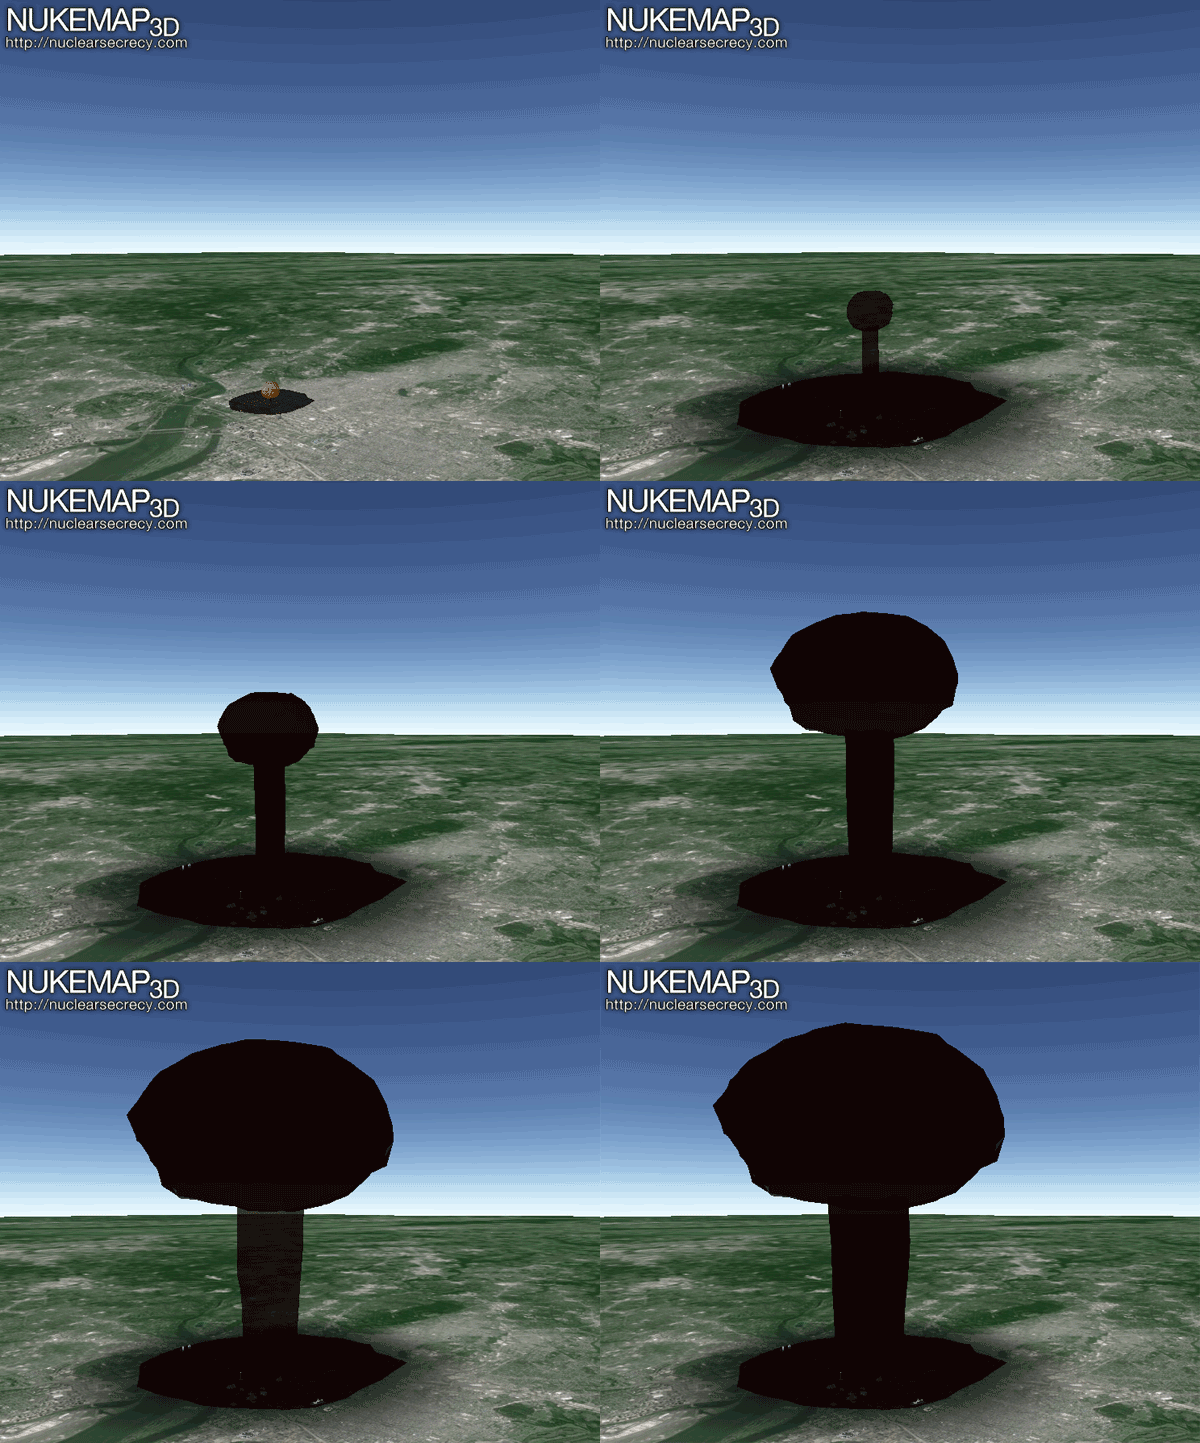
Screen captures of the animation for a 20 kt detonation over DC. These screenshots were taken in 10 second intervals, but are accelerated 100X here. The full animation takes about five minutes to run, which is roughly how the cloud would grow in real life.
If you’ve been following my Twitter feed, you also probably have picked up that this has been a little bit of a saga. I tried to launch it on last Thursday night, but the population database wasn’t really working very well. The reason is that it is very, very large — underneath it is a population density map of the entire planet, in a 1km by 1km grid, and that means it is about 75 million records (thank goodness for the oceans!). Optimizing the queries helped a bit, and splitting the database up helped a bit. I then moved the whole database to another server altogether, just to make sure it wasn’t dragging down the rest of the server. But on Monday,just when the stories about NUKEMAP started to go up, my hosting company decided it was too much traffic and that I had, despite “unlimited bandwidth” promises, violated the Terms of Service by having a popular website (at that point it was doing nothing but serving up vanilla HTML, Javascript, and CSS files, so it wasn’t really a processing or database problem). Sigh. So I frantically worked to move everything to a different server, learned a lot about systems administration in the process, and then had the domain name issue a redirect from the old hosting company. And all of that ended up taking a few days to finalize (the domain name bit was frustratingly slow, due to settings chosen by the old hosting company).
But anyway. All’s well that ends well, right? Despite the technical problems, since moving the site to the new server, there have been over 1.2 million new “detonations” with the new NUKEMAPs, which is pretty high for one week of sporadic operation! 62% of them are with NUKEMAP3D, which is higher than I’d expected, given the computer requirements required to run the Google Earth plugin. The new server works well most of the time, so that’s a good thing, though there are probably some tweaks that still need to be done for it to happily run the blog and the NUKEMAPs. There is, though I don’t want to make it too intrusive or seem too irritating, a link now on the NUKEMAP for anyone who wanted to chip in to the server fund. Completely optional, and not expected, but if you did want to chip in, I can promise you a very friendly thank-you note at the very least.
Now that this is up and “done” for now, I’m hoping to get back to a regular blogging schedule. Until then, try out the new NUKEMAPs!


Is there anyway to get Nukemap to be able to show multiple detonations simultaneously?
If you mean NUKEMAP2, the “Launch multiple” button will unhook the cursor from any given effects and allow new effects to be assigned to it. So for two nuclear detonations, you first detonate one, then click “Launch multiple,” then move the cursor, then click “detonate” again.
For NUKEMAP3D, every time you click “Place target” it allows for a new detonation to be rendered. If you want to see more than one animated one going off simultaneous, you must place more than one target, then “Generate permalink,” and then follow the link it gives you. For an example, click here. Note that multiple animated detonations running simultaneous can be very intensive for your computer.
I modeled the Fukushima Daiichi incident on NUKEMAP2, but had to replace the actual explosion with a 10 kiloton surface burst (North Korean bomb). There were no fatalities/injuries, and the radiation traveled northeast. That’s accurate! (I think)