A few months back, the National Security Archive made national headlines when they released a 1956 US target list they had obtained under the Freedom of Information Act. The target list outlined over a thousand Strategic Air Command nuclear targets in the Soviet Union, Eastern Bloc, the People’s Republic of China, and North Korea. The Archive had posted a small graphic of the ones in Eastern Europe, but hadn’t digitized the full list. Several weeks ago, the people at the Future of Life Institute did just this, digitizing the complete dataset — no small task, given that these were spread over several hundred, non-OCR-able pages of smudgy, 60-year-old government documents.1

A sampling of the 1956 target list obtained by the National Security Archive. The digits encode latitude and longitude points, among other bits of information.
I recently attended a conference that the FLI put on regarding nuclear war. FLI was co-founded by the MIT physicist Max Tegmark and his wife Meia (among a few others), both of whom I was glad I got to spend some time with, as they are interesting, intelligent people with interesting histories. They are interested in promoting work that decreases existential threats to the human race, which they see as possibly including things like nuclear war and nuclear winter, but also unhampered artificial intelligence, climate change, and the possible negative futures of biotechnology. These are all, of course, controversial topics (not always controversial among the same groups of people, to be sure). They’re an interesting group, and they are stirring up some interesting discussions, which I think is an unambiguously positive thing even if you don’t agree that all of these things are equally realistic threats, or threats on the same level.2

The FLI’s digitized version of the target list. Click the image to view their interactive version.
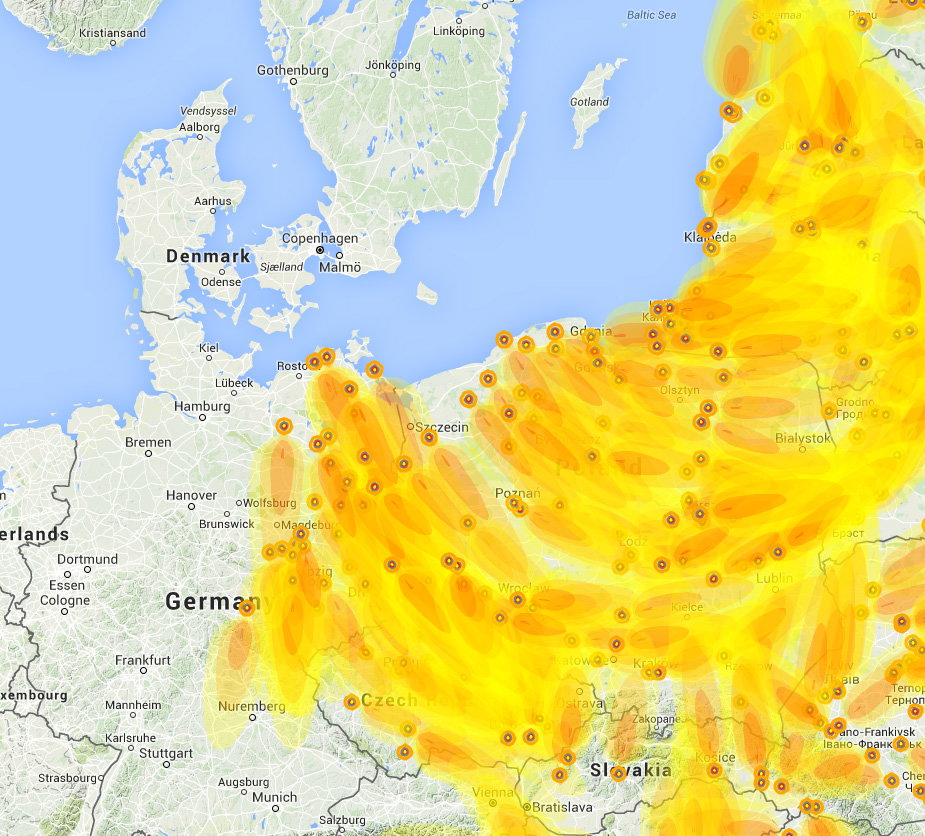
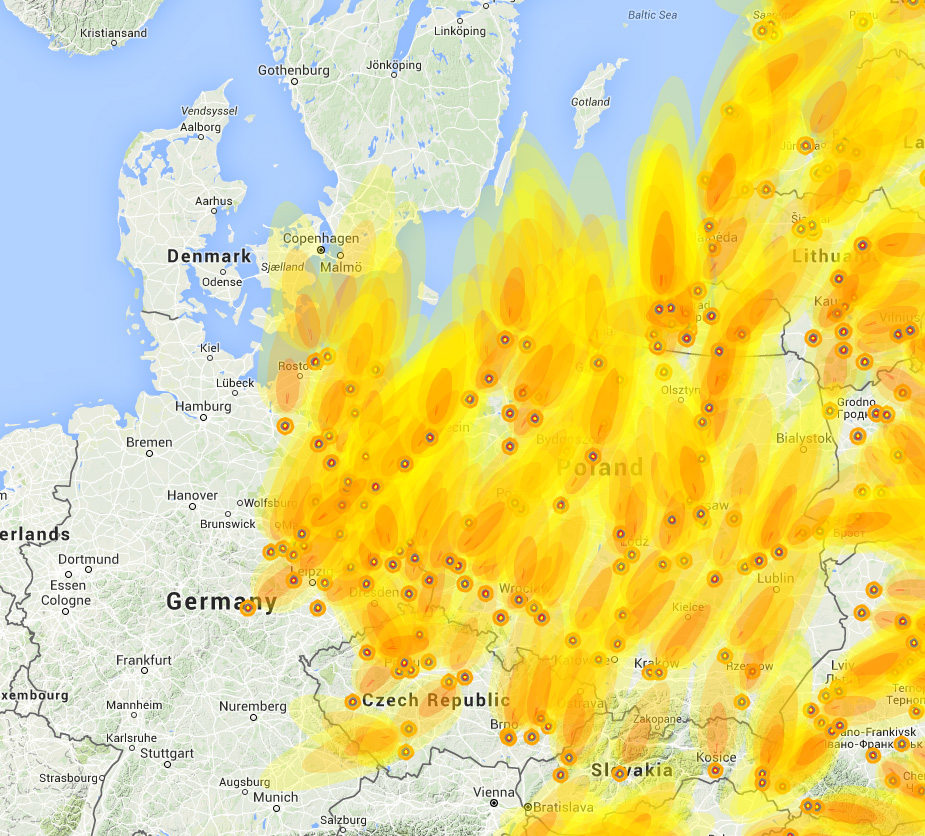
The target list, mapped out as the FLI did above, is already pretty impressive. While I was at the conference, I got the idea that it wouldn’t be that hard to reconfigure a few parts of the NUKEMAP code to allow me to import huge numbers of target lists in the right format. NUKEMAP already supports the targeting of multiple nukes (the feature is a little cryptic — you create a detonation, then click “launch multiple,” then move the cursor and can then create another one, and repeat as necessary), but it didn’t have any automatic way of importing a large number of settings. Once I had done that, I then thought, what would it look like if I used realistic weather data to determine the fallout patterns from surface bursts? It only took a little bit of further work to write a script that can poll OpenWeatherMap‘s public API and grab information about real-time wind speed and direction information about any given set of coordinates.3 This renders quite an impressive image, though to do this for some 1,154 targets requires a lot of RAM (about 1.5 GB) and a fast computer. So it’s not something one wants to necessarily do all the time.
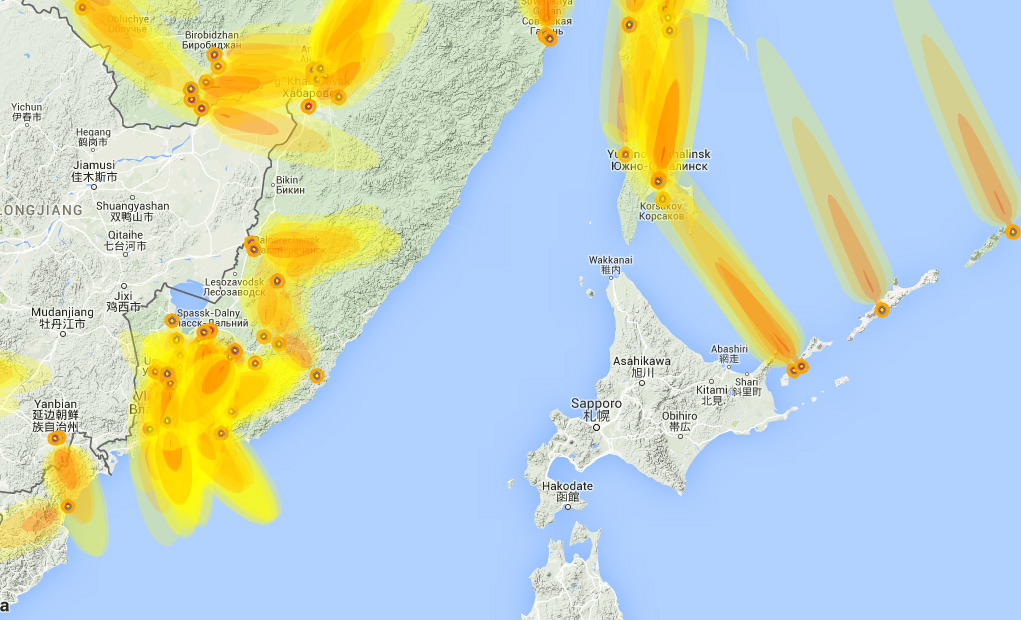
I have captured the results as a series of interactive screenshots, to better save you (and your web browser) the trouble of trying to render these yourself. You can see how changing the yield dramatically changes the fallout (assuming surface bursts, of course). The interactive viewer is available by clicking the image below, or this link.4

Screenshot of my interactive viewer for the nuclear war plan. Click to view.
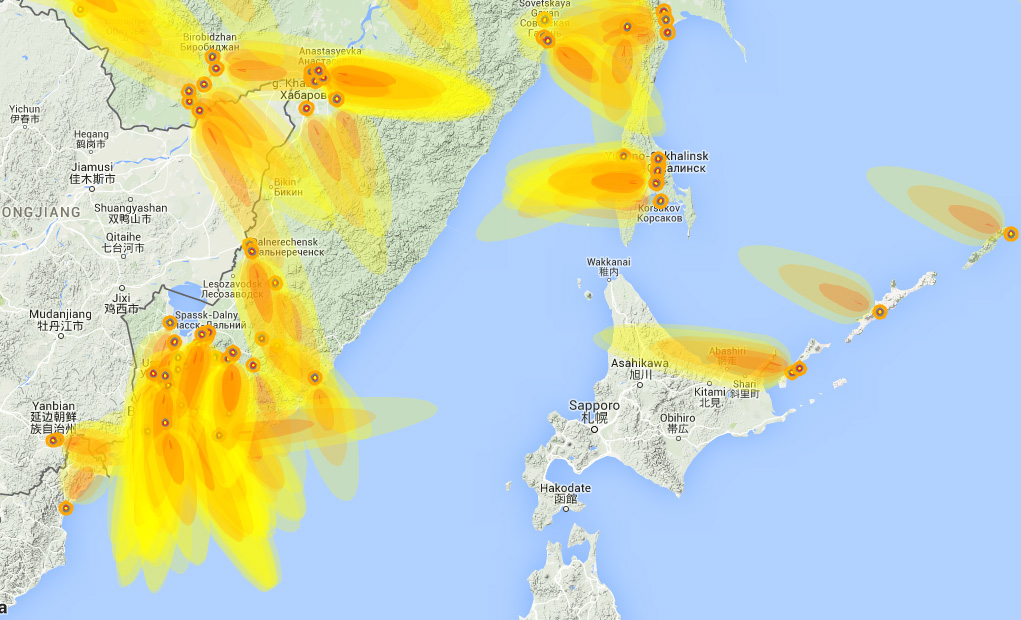
I also sampled weather data from a few days in a row, to see what differences it made from a practical standpoint. It is remarkable how different wind speed and direction can vary from day to day. In some of these “simulations,” Copenhagen, Denmark, avoids fallout. In others, it does not. Under some weather conditions (and yield selections), northern Japan gets some fallout from an attack on the Soviet-controlled Kuril Islands; in others, it does not. The NUKEMAP’s fallout estimator is, of course, a very simplified model, but even with that you can get a sense of how much difference a shift in the winds can make.
Having done that, I started to wonder: what would the casualties of such an attack look like? I don’t have population density data of the relevant areas from 1956 that has sufficient granularity to be used with my normal NUKEMAP casualty estimating script, but I figured that even the present-day population figures would be interesting. If you try to query the casualty database with over a thousand targets it just says “no,” so I wrote another script that would query it target-by-target and tally the results.
The results were a bit staggering. I mean, I assumed it would be a large number. But they are really large numbers. Some of this is because the casualty script is double-counting “victims” when they are inside the relevant blast areas of multiple detonations. At the moment, there’s no easy way around that (even for a small number of detonations, keeping track of who is already “dead” would require a lot of time and processing power, and to do it on the scale of a thousand is just not possible with the way it is set up currently).

An example of an area where a lot of “double-counting” is taking place — St. Petersburg. The circles show various pressure rings for 1 Mt weapons, which are used by NUKEMAP to calculate casualties. Maybe just a little overkill…
On the other hand, the casualty estimate does not take into account fallout-related casualties, or the long-term casualties caused by the destruction of so much infrastructure. The target list also doesn’t tell us how many targets were, in fact, targeted redundantly with multiple weapons — the idea that it might have been “one nuke, one target” is definitely an incorrect one. Even before World War II had completely ended, US planners for nuclear war against the Soviet Union understood that not every bomb would make it to a target, and so planned for multiple weapons to be targeted on each. So “double-killing” those people in some of these locations is probably not so wrong. It likely isn’t all that crazy to think of these numbers as back-of-the-envelope estimates for what would result if you waged this kind of attack today (which is not to imply that the US would necessarily do such a thing). But I don’t want anyone to think I am implying any kind of real certainty here. I would, in fact, be dubious of anyone, at any time, implying a lot of certainty about these kinds of things, because we (fortunately) lack very much first-hand experience with this kind of “data,” outside of the results at Hiroshima and Nagasaki, which were in many ways particular to their time and place.
Casualty figures, of course, require making assumptions about the size of the nuclear weapons used, as well as the fuzing settings (airbursts generate far less downwind fallout in comparison to surface bursts, but they can greatly increase the casualties for people in civilian structures). For 1956, there would have been a “mix” of yields and types of weapons. We don’t have data on that to my knowledge. As a simplifying assumption, I just ran the casualty calculation with a number of yields, and with both surface burst and airbursts (optimized to increase the range of the 5 psi blast area) options. For the sake of space and avoiding the appearance of false precision, I have rounded them to their nearest million below:
| surface burst | airburst | |||
| injuries | fatalities | injuries | fatalities | |
| 10 Mt | 259 | 239 | 517 | 304 |
| 5 Mt | 210 | 171 | 412 | 230 |
| 1 Mt | 120 | 70 | 239 | 111 |
| 500 kt | 89 | 46 | 185 | 77 |
| 100 kt | 39 | 16 | 94 | 30 |
| 50 kt | 25 | 10 | 66 | 19 |
At first I thought some of these numbers just seemed fantastical. Russia today only has a population of 140 million or so. How could we get up to numbers so high? Some of this is, again, because of double-counting, especially with the very big bomb — if you run a 10 Mt bomb on Moscow kills 5.5 million people, and injures 4 million, by NUKEMAP’s estimate, which combined is 70% of the 13 million people in the area of the 1 psi blast radius of such a weapon. (If that seems high, remember that a 10 Mt bomb goes well outside the city of Moscow itself — the Great Moscow Metro Region is about 16 million people total.) Since a large number of nukes were targeted around Moscow, that’s a lot of double counting, especially when you use them with such high-yield weapons.
So the very-big numbers I would take with a very hefty grain of salt. NUKEMAP’s casualty estimator really isn’t meant for guessing multiple, overlapping damage areas. At best, it attempts to give back-of-the-envelope estimates for single detonations. Separately, the US arsenal at the time was around 10,000 megatons worth of destructive power. So they obviously couldn’t have been (and wouldn’t have been) all multi-megaton monsters. But, all the same, I don’t think it’s at all improbable that the multi-megaton monsters that were in the arsenal would have been targeted at heavily populated regions, like Moscow. Especially given the fact that, again, there would have been multiple nukes aimed at each target.
I also thought it would be interesting to take the casualties and break them apart by region. Here’s where I found some really startling results, using a 1 Megaton (1,000 kiloton) airburst as my “model” detonation, again in millions:
| injuries | fatalities | |
| Soviet Union | 111 | 55 |
| Warsaw Pact | 23 | 10 |
| China + North Korea | 104 | 46 |
| 239 | 111 |
To make this point more clearly: 820 of the 1,154 targets were inside the Soviet Union proper. They are responsible for 48% of the casualties in the above scenario. Non-Soviet countries in the Warsaw Pact (Eastern Europe, more or less), were responsible for “only” 188 of the targets, and 9% of the casualties. China and North Korea had only 146 of the targets, but were accountable for 43% of the casualties. Which is to say, each “detonation” in the USSR on average produced around 203,000 casualties on average, each one in Eastern Europe around 176,000, and each one in Asia is over 1 million. That’s kind of bananas.
Now, these use modern (2011) population density figures, not those of 1956. But it’s still a pretty striking result. Why would this be? Partially because the Asian targets seem to be primarily in large cities. Many of the Soviet targets, by contrast, are of pretty isolated areas — remote military airfields in some cases — that only kill a few hundred people. It would make for a very interesting study to really get into the “weeds” of this target plan, and to sort out — systematically — what exactly was being targeted in each location, as best as we can. If we did that, we’d possibly be able to guess at whether an airburst or a surface burst was called for, and potentially even be able to judge target priorities, though the “bomb-as-you-go” method of attack used in the 1950s probably means that even low-priority targets would get nuked early on if they were on a path to a higher-priority one.

Total megatonnage of the US nuclear stockpile — nearly 10 gigatons by 1956, climbing to a peak of over 20 gigatons in 1959. Source: US Department of Energy
What does this exercise tell us? Two things, in my mind. One, this 1956 target list is pretty nuts, especially given the high-yield characteristics of the US nuclear stockpile in 1956. This strikes me as going a bit beyond mere deterrence, the consequence of letting military planners have just a little bit too much freedom in determining what absolutely had to have a nuclear weapon placed on it.
The second is to reiterate how amazing it is that this got declassified in the first place. When I had heard about it originally, I was pretty surprised. The US government usually considered target information to be pretty classified, even when it is kind of obvious (we target Russian nuclear missile silos? You don’t say…). The reason, of course, is that if you can go very closely over a target list, you can “debug” the mind of the nuclear strategist who made it — what they thought was important, what they knew, and what they would do about their knowledge. Though times have changed a lot since 1956, a lot of those assumptions are probably still at least partially valid today, so they tend to keep that sort of thing under wraps. These NUKEMAP “experiments” are quick and cheap approaches to making sense of this new information, and as the creator of the NUKEMAP, let me say that I think “quick and cheap” is meant as a compliment. To analyze something quickly and cheaply is to spark new ideas quickly and cheaply, and you can always subject your new ideas to more careful analytical scrutiny once you’ve had them. I hope that someone in the future will give this target data some real careful attention, because I have no doubt that it still contains many insights and surprises.
- Because there has been some confusion about what this list is, I want to clarify a bit here. It is a “Weapons Requirements Study,” which is to say, it’s the way in which the US Air Force Strategic Air Command said, “here are all the things we might want to nuke, if we could.” The might and if we could parts are important, because they are what makes this difference from an actual war plan, which is to say, “what we would actually do in the event of a nuclear war.” The might means that not necessarily all of these targets would have been nuked in any given war situation, but indicates the sorts of things that they considered to be valid targets. The if we could means that this would require more weapons than they could afford to use at the time. In 1956, the US stockpile contained “only” 3,692 warheads. This target list is meant to imply that it needed to be bigger, that is, that by 1959 they would want more weapons to be produced. So by 1959 they had 12,298 weapons — more than three times as many. Why so many weapons for the same number of targets? Because, as noted in the post below, the idea of one-nuke, one-target isn’t how they planned it. Anyway, the long and short of it is, this isn’t exactly the same thing as a war plan, much less for 1956. It may over-count, but it also probably under-counts (because it ignores tactical use, targets of opportunity, the overkill that would occur when targets were multiple-targeted, etc.). But it does give you a flavor of the war planning that was going on, and is probably closer to that than any other document that has been released for this time. As for how that would affect what would have happened in 1956, it’s hard to say, but this is in line with many of the other things we know about nuclear war planning at that time, so I think it is a fair illustration. [↩]
- I think my students were probably the most happy that FLI digitized all of this target data because if they hadn’t, I was going to force my undergrads who take my data visualization course to do it in the name of a practical example of what “crowdsourcing” can mean. [↩]
- In some cases, OpenWeatherMap did not have information about some of the coordinates. In such cases, the script averaged the missing point from several surrounding points, weighting them by distance. The results it gives in doing this seem plausible enough. For each time I ran it, there were only about two or three missing pieces of data. [↩]
- For those who want to look at the dataset themselves, the CSV file that the visualization uses is available here. [↩]


“We’re targeting all the missile silos in Russia” was obvious.
“Which missile silos do we know about?” might not have been obvious, and “How did we find out about them?” was also not too obvious (though for many of them, the answer would be aerial photography of big holes in the ground.)
Right. Which is one of the reasons they don’t usually declassify this sort of thing.
Of course, there were no missile silos in the Soviet Union in 1956.
Interesting to see that the US had planned to drop a nuke slap bang in the middle of Berlin – both East and West losing out…
Perhaps, in 1956, if a war would have started, West Berlin would be under control of the communist bloc by the time a nuclear weapon would have arrived.
Alex,
Does this just indicate a list of possible targets, some of which might be hit in certain circumstances, (i.e., a war with China or North Korea would not necessarily mean war with USSR) or is it really as Strangelovian as it looks at first glance?
Thanks!
Hi Mark,
I am not sure how much “flexibility” this particular plan had. Some of the early plans did not allow for any whatsoever — China had to go no matter whether they were part of the war or not. Kennedy himself balked at this when he came into office and tried to allow himself more options. But as Francis Gavin points out in his Nuclear Statecraft (in the chapter on “The Myth of Flexible Response”), even into the Nixon administration the “options” could be pretty limiting, if you wanted an option that didn’t involve destroying millions of people. This is one of the places where the military and civilian planners did not always see eye to eye.
I really can’t see Ike buying this, but, those were different times. We know a lot more now, and of course “Nuclear Winter” was unknown in 1956 – but, good grief, holy overkill, Batman! Which general or admiral was it who said words to the effect that the only reasons we didn’t “go there” was dumb luck and divine intervention, probably mostly the latter?
Eisenhower thought thermonuclear war was impossible to win. But he also felt hemmed in by his times.
The General in question was General George Lee Butler, head of the Strategic Air Command in 1991. He went over the nuclear war plans (the SIOP) in detail and concluded:
For more on the source and scope of the absurdities and immense overkill in the SIOP (which existed well into the 1980s), see the first nine minutes of Part 4 of “U.S. Strategic Nuclear Policy: An Oral History, 1945-2004,” an excellent documentary produced by Sandia National Laboratories and made available by the National Security Archive in late 2011 – https://www.youtube.com/watch?v=ppPgvFKfEII.
Mark,
According to the documents themselves, this list is a “nuclear weapons requirements study” – not an actual list of targets themselves (much less a full war plan), but “a list of all reasonable targets the SAC staff could come up with” that would then be used to estimate weapon production requirements for 1959. We don’t really know how many of those targets would really make into the target list – in 1956 it would be still a minority (there were not enough bombs).
On the other hand, the list is also highly underinclusive: while the National Security Archive obtained the full documents under FOIA, it only published one of the two lists in full (a list of all airfields in the Soviet block). Of the second, apparently larger list (governmental, industrial and military targets) it only published excerpts (pages listing targets located in the Soviet block capitals and major Soviet Union cities). Judging from the map, it seems that the FoLI folks have only digitised targets from the portions of the documents released by the National Security Archive – so there are still hundreds of industrial, governmental and military targets we don’t know anything about.
So on the balance: the list is party overinclusive (some of the targets there probably had never made it into the actual target list, as others have been judged more promising) and partly underinclusive (doesn’t include all targets).
Terrific posting.
Last month the National Security Archive updated the posting of the SAC targeting study for 1959 by publishing in its entirety the first of the two lists of urban complexes and installations (the two lists are essentially the same; the difference is in the excised, still secret, information on weapons assignments for each airbase and installation). Darek is correct that the SAC lists of airbases and urban complexes are not the same as the “actual list” of the targets that would have constituted the SAC war plan. Presumably, the list would have included many of the listed airbases and installations, but it would have been a somewhat shorter list, but perhaps not that much shorter because more weapons would have been available by 1959. The first SIOP, prepared in the fall of 1960, included over 1200 targets to be struck by some 3,000 weapons, the overkill which dismayed Navy leaders and White House scientists.
I imagine the actual casualties would probably be quite a bit higher .. I’m thinking of that recent(ish) study that estimated that even a “small, regional” nuclear exchange between India and Pakistan (~50 bursts) would be enough to destroy the ozone layer over the entire northern hemisphere. This would be.. bad.
Yeah, these are only estimates of the acute (i.e. immediate, short-term) casualties. If one guesses that this would involve even an expenditure of only half of the US arsenal at the time — 5,000 megatons — that’s a ridiculous amount of burning that would occur.
Question: a US bomber is flying over the Soviet Union. How many bombs were aboard each airplane, and could the aircrews voluntarily switch them out?
“Hey, Fred, I got a bad feeling. Let’s drop the bigger one first, just to be sure.”
By 1956, I think there were a number of different sorts of planes in service, including the B-36 and B-52, both of which could carry a lot of weight. I don’t know what their standard bomb outfitting would have been, though. Something to look into at some point.
Standard B-52 load in the later days of the Cold war – apparently affectionately known as the ‘doomsday loadout’ – was 4 B28s, 8 SRAMs, and 12 ALCMs. Before that, Hound Dogs in place of the ALCMs, and Quails in place of the SRAMs. Obviously, subject to variation depending on the particular target package.
I have read (Wikopedia) that the B-36 could carry either one or two B-17 bombs. (conflicting reports) It could of course carry more smaller bombs, but I think it was designed in conjunction with the B-17. I’m thinking in 1956 this would have been mostly or entirely manned bombers,
Standard load for a B-52 with cruise missile integration (CMI) was 12 AGM-86B ALCMs, 6 or 8 AGM-69A SRAMs, and 4 Mk28 or 4 Mk61 “conventional” bombs. The bombs were loaded together in a “clip-in” unit. SRAMs and bombs were carried in the bomb bay, ALCMs under each wing (6 ALCMs on single pylon per side).
Non-CMI aircraft carried similar internal loads, with no external weapons.
B-52s without Offensive Avionics System (OAS) were limited to free fall weapons. OAS aircraft have the little turrets under the nose for infrared and low-light cameras.
OAS and CMI were 1980s add ons to B-52Gs and B-52Hs.
A B-52 could only carry 2 AGM-28 Hound Dogs (1 per side), so the AGM-86 gave a big increase in firepower per sortie.
What’s the significance of the color coding – yield? Type of target? Target nationality?
The colors correspond with “alliances” — Soviet Union, Warsaw Pact, and China + North Korea. These are loose groupings, but I thought they were more useful than individual countries.
Oh. Thanks for the info. Great article. The indicated warplan (plus whatever strikes were conducted by the USSR in W. Europe, Japan, Canada/US etc) would have spelled a long, very bad day (and decades following nuclear winter or no) for the Northern Hemisphere…and by extension the whole of the globe.
There was a very big drop in megatonnage available, if I am reading the graph right, from 1960 to 1961. Was this due to retiring the B-36 and the Mk-17 bombs that only it could carry?
The Mk-17 was retired by then; it’s the retiring of several hundred Mk-36 bombs that did it. As Carey Sublette puts it, “at retirement this weapon represented almost half of the megatonnage of the U.S. arsenal.”