Five years ago today I introduced the NUKEMAP. It feels practically like yesterday — how fast that has flown! I occasionally get college students, not even brand new ones, who tell me that they used it in high school to do reports. That makes me feel… well, like I’ve contributed something, along with feeling old. So that’s not bad. I’ve been behind on posting for awhile now, and am behind on several things at the moment (lots of irons in the fire, plus the debilitating power of a news cycle that seems to change by the minute), but I wanted to put up something about the NUKEMAP.

NUKEMAP and NUKEMAP3D page views, exported from Google Analytics and cleaned up a bit, with a few of the “known” moments of virality indicated. Note how the “baseline” had steadily increased over time.
Some statistics: NUKEMAP has been the host of over 99 million virtual detonations, according to its internal logs. Every detonation, except for ones where people have opted-out of logging, is logged. As I’ve said before, I don’t record enough information for it to be non-anonymizing, but it’s interesting to see things like where people nuke, and what they do with the tool. According to Google Analytics, there have been (as of this checking) over 25 million pageviews, over 20 million of those unique pageviews (e.g., not people coming back and using it multiple times in one session). The usage of the site predictably flares up in certain moments of “virality” (for the 70th anniversary of Hiroshima, over 500,000 people used it over two days), and still have sharp moments of heavy traffic every few months. More interesting and important to me is that the site’s “slow days” are now not so slow. When it started, a “slow day” was a few thousand people using it. Today, it’s more like 15,000-20,000 people using it. And, for the most part, people are really using it: the average time on page is 5 minutes, which I think is pretty healthy for a web visualization used by tens of thousands of people a day. That means people are doing more than just clicking and glancing — they’re actually trying things out.
NUKEMAP3D is, for the moment, moribund. Google unceremoniously discontinued support for the Google Earth Web Plugin (the code on their end is just kaput), and no adequate substitute has yet emerged. There are some ways of crudely rendering a 3D planet on the web, but none that support buildings and skylines the way Google Earth did, and that is the whole point of NUKEMAP3D. However, I am developing a temporary substitute which is almost ready to roll out: it will allow you to export any NUKEMAP settings to a KMZ file which you can open in the Google Earths standalone program, and it will support mushroom clouds among other interesting features.

“Alas, poor NUKEMAP3D! I knew him, Horatio…” Don’t worry, NUKEMAP3D isn’t really dead, just waiting for better circumstances…
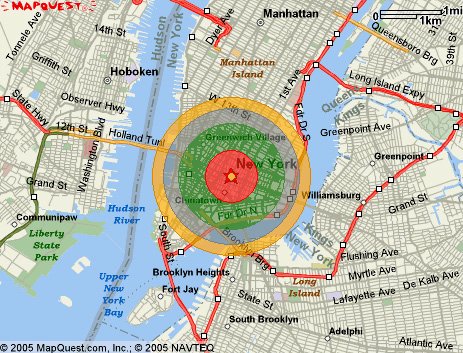
Some reflections: I still remain surprised that NUKEMAP has been as popular as it was. The idea of drawing concentric circles over a map is not a new one, and mine was not even the first web one. Heck, it wasn’t even the first web one for me — in 2005 or so I made a terrible crude version using MapQuest (remember them?) and PHP, and it wouldn’t have been sustainable to use (it literally used PHP to draw circles over static images from MapQuest, so it was very server-intensive by the standards of the day). But I did try to make a version that was easier to use than any of the other ones that were out there, and gave more intuitive, useful information. And when I upgraded NUKEMAP in the summer of 2013, I really did think it was contributing new possibilities: much more flexible detonation options, casualty estimates, a fallout model.
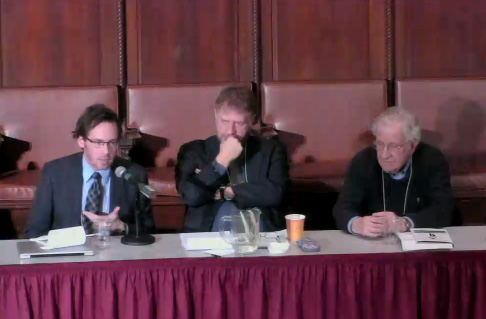
I still give talks about NUKEMAP all the time, whether to large groups (I was on a panel with Noam Chomsky a few years ago, talking about NUKEMAP), or to individual reporters (I did another interview on it just yesterday), or to small groups of students (I Skyped into a high school class a few weeks ago to talk about it, and how it was made, and how these students should not think of it as something beyond their capabilities to put together, something I don’t mind doing if I can make the time for it). I teach a course regularly (“Visualizing Society,” a sort of anarchistic data visualization/science and technology studies course) where I show students how to build NUKEMAP-like applications for other sorts of social phenomena. I still make updates and plans for updates to it: there are several projects in the works, including “refreshing” the interface a bit (don’t worry, it won’t end up looking painfully “trendy”; the blog could probably use a refresh, too), translating it into other languages (which requires more back-end coding than you might expect), and adding new substantive features (I have almost put the final touches on a nuclear burning model and better support for multiple detonations).

For me, the “holy grail” would be something that would let you see something like the Defense Civil Preparedness Agency made in 1973: a “personalized” view of what different damage looked like, from the street level. The technology for this isn’t quite here yet, but it’s not that far away, either.
I have a very long “wish list” of things that would be interesting to add: EMP features, a dynamic (time-sensitive) fallout model, support for the effect of terrain or dampening by buildings, and so forth. I do have some students who occasionally work for me, especially in the summer, on aspects of these issues, and some of this work may eventually make it into future versions of the NUKEMAP. I’m also interested in translating the NUKEMAP concept — this “personalizing” of nuclear weapons effects — into non-web domains as well. The main difficulty here is time: NUKEMAP is still a mostly one-man operation (imagine me in the salt mines, toiling out Javascript), and this one-man is (to his delight) admirably busy with a lot of things. I am very positively supported in this work by my university, I should say, and the College of Arts and Letters at the Stevens Institute of Technology has been paying the ever-increasing fees associated with running a popular website since I got here, and encouraging me to do even more with it.
I suppose one thing that I’m grateful for is that I’m not yet even slightly bored with any of it — I still find talking about it interesting, I still find it a model of how we might consider science communication to look in our present age. I strongly believe, and will evangelize about to anyone who asks me to (as many have found, probably without realizing what they were getting into), that there is something different about providing a sort of “simulation” to a user and saying, well, you figure out how this works, as opposed to a more didactic mode of education like lecturing. This has strong shades of “active learning,” but I’m not just talking about an approach to the classroom. One nice thing about tools like NUKEMAP is that I can see (through referring links) how people are using them. My favorite example, and this comes up all the time, is when people use it to argue with other people on the Internet. Someone will say, wouldn’t a nuclear bomb do X? And someone says, well, the NUKEMAP says it will be more like Y. And there’s this kind of “calibration” of understanding, as I think of it, that starts to narrow down what these weapons do and don’t do. (And it goes both ways: most people think they are more powerful than they are, but some think they are less powerful.) The NUKEMAP model, as I discuss in its FAQ, isn’t perfect by any means: in some circumstances it probably overestimates the effects (by not taking into account a lot of local variables), in others it probably underestimates them, and the “real world” is much more chaotic than a simple model that can run in your browser can account for, no doubt. But it helps to concretize the experience, the order of magnitude. I think there’s a lot of value in that, when we’re talking about something so removed from everyday human experience (thank goodness) as a nuclear weapon detonation.
And I think this is a model we need to really do more to export to other domains: nukes are one thing in our society that people have trouble really understanding on an intuitive level, but there are plenty more. This is what my “Visualizing Society” class is all about, at its core: finding ways to make interactive data visualizations or simulations that shed light on complex real-world issues. The technical bar for doing these things is lower than most people realize; if I can teach undergraduates (very good and often technically-inclined undergraduates, to be sure, but often ones with no coding experience) the basics of this over the course of a semester, then it can’t be that hard.

The original “NUKEMAP” — Hiroshima, before and after, from the view of a nuclear bombardier.
My main frustration with NUKEMAP as a communication tool is that the top-down, concentric-circles approach is the view of the military planner. It’s the view of the nuclear targeteer, or as a friend and collaborator put it earlier this week, it’s the view of real estate. It’s not the view of the person on the ground, it’s not the view of the survivor, it’s not the view of the victim. NUKEMAP3D did provide some aspects of that, but the Google Earth plugin, for its communicative benefits, was clunky to use (the 3D interface was not straightforward), required a special installation, and it was never as popular as the regular NUKEMAP. (I was, however, still impressed that some 3 million people used it over its lifetime.) I’m hoping that some future projects I have in mind (no spoilers, sorry) will address these issues more directly and more intensely.
Anyway, more is on the horizon, as ever, and it is just a matter of figuring out how to get it all done. More NUKEMAP, more NUKEMAP-like creations, more work. I’m grateful for NUKEMAP: what started out a literally two-day coding job (one resting, of course, on a decade of coding experience, and even some actual code that I had written a long time ago, to be sure) has turned into something of a guiding idea for a career. It definitely increased the popularity of my blog (whose traffic is admirably high for an academic, despite the fact that I am greatly remiss in updating it lately), and became a selling-point for the kinds of hybrid technical-historical-analytical projects that I never knew I had wanted to spend my life working on (though I did have some inklings). Anyway, much more is coming. When I go silent, don’t think, “what’s happened to him?” Instead, think, “what’s he getting ready for us, next?” There’s a lot in the pipeline.


Your NUKEMAP pageview graph shows a 200,000+ spike on or about January, 2017. Was that perhaps coincident with the broadcast of PBS’s documentary “Command and Control” on the Damascus Titan II silo explosion in September, 1980??? I know _I_ headed right out to NUKEMAP to detonate a 9MT surface burst north of Little Rock, learning that the fallout reaches to Indianapolis…
Great job!
Jay Boggess
Alex your work is so appreciated. Have u used nuke map to simulate nuclear war scenarios and their effects and if so where can I find these? Looking for something like nuke war say between India and Pakistan for example. Also have collaborated with someone like ALAN Robock to combine your nukemaps with nuclear winter scenarios. Thanks. Mark
Alex, I want to thank you for creating this and for all the time you’ve put into it. I’d also like to thank you for the missile map, even though it’s still in beta. You’ve done a great deal to help people understand nuclear weapons and their effects. It’s really appreciated.
Wonderful write-up, Alex! Having done some related work in media for understanding, I thought I’d link a few things!
When I made Dictionary of Numbers, one of my top wishes was to figure out how I could directly engage with whatever models people had in their head of quantities. If you’ve never seen the Eiffel Tower then a comparison to its height would be kind of useless for you, but could be wonderfully helpful if you grew up in Paris, for example.
I hope you can figure out a way to include that kind of “ground-level” (pardon the pun) understanding in whatever you come up with next! It’s a great insight to have and a laudable goal. (I idly wonder if game programmers would have any expertise that might be helpful.)
I like this sentiment a lot! One way I interpret that statement is that the goal is to have someone make the knowledge their own instead of having the knowledge dished out by an authority figure. I’d like to think that anyone that has had any encounter with real knowledge knows that it’s not something that can be given to you by anyone else. This is one of the underlying assumptions I did in my remake of an episode of the civil rights documentary “Eyes On The Prize”. More, the books about learning that have captured some of this sentiment and have have been highly influential for me are Mindstorms by Seymour Papert, How Children Fail by John Holt, and How Children Learn by John Holt. Maybe you’ve heard of these or would find them interesting!
Bret Victor wrote a few tweets trying to point toward what he sees as the real promise of dynamic media / simulation: using models to actively understand and discuss. He writes a little about that in his essay about Explorable Explanations if you haven’t seen it.
Great achievement, Alex! Looking forward to next big thing in the pipeline:)
Good job, Alex. Perhaps you can soon put up a sign like McDonald’s used to have: “100 million detonations served!”
And if you are looking for more enhancements to NUKEMAP, how about weather? If it’s raining your thermal effects should be way different. Your work is never done…
I find it hilarious that I just happened to remember the NUKEMAP page today and drop by for another visit….on its birthday. Anniversary? Whatever. Anyhow, congratulations on five years of blowing things up virtually. 🙂
Hi there –
Amazing program – unique and very helpful…You should be very proud and should be recognized more for your achievement. With that being said, I hope you’d consider making a few tweeks…couple suggestions…
I am a journalist trying to use Nukemap to model out a first strike but the permalink setting won’t save above a certain number of detonations – 250-300….it just loads and loads and never materializes. Is Nukemap governed to limit detonations and is there a way around this?
Also, is there a way you could build in something that prevents double counting fatalities in a multiple bomb scenario. With the largest bombs deployed being in the 1MT range for both the US and Russia, an attack will probably involve MIRV missiles with 10 or so bombs per city – it is hard to accurately model that out using the current system as it double and triple counts the fatalities…
There isn’t any inherent load limit, but it may run into some issue with sending that much data over AJAX or something.
There is an undocumented, sort of “beta” means of loading lots of detonations from text files.
The text file itself is basically one giant “permalink” for NUKEMAP. So it needs to start with a zoom coordinate, e.g., &zm=3. After that, it follows the permalink format which is outlined here. The only difference from that page is that for multiple detonations you will put square brackets after the variables, e.g.:
Describes two similar detonations that differ only in their locations (their lat and lng are different, slightly) and their wind speeds and directions for fallout (which can be neglected if you aren’t modeling fallout). Every time you have a &kt entry it will interpret that as a new detonation, so you can just “stack” lots of them together that way.
In something like a spreadsheet, you should be able to make formula for each line that formats it as you want it, and then copy the whole result to a text file.
Once it is in a next file you can have it loaded into NUKEMAP by the following means: go to http://nuclearsecrecy.com/nukemap/?load=FILEPATH where FILEPATH is the URL to the text file.
Example of a text file with three detonations: http://blog.nuclearsecrecy.com/misc/targets1956/example.txt
Example of how that works: http://nuclearsecrecy.com/nukemap/?load=http://blog.nuclearsecrecy.com/misc/targets1956/example.txt
All of this is recognized as slightly clunky at this point — the goal is just to make it a little easier to get lists of targets in there without manually loading them, or overloading the capacity of the URL decoder (which has a maximum length in most browsers) to deal with them.
It should plot the lat/lngs exactly as you input them. If it doesn’t, I’d be interested in knowing that!
So this doesn’t answer your question exactly, but if you created a spreadsheet of targets you could easily make a formula that would export the lat/lng coordinates into a text file of this sort, and then load it all at once. Note that it is still entirely contingent on your browser being powerful enough to load all of those simultaneously; when I did the 1956 targets map, it took something like a gigabyte of RAM just to render it.
Hello Alex,
I would just like to express how much I appreciate your hard work and commitment to creating such an amazing platform for folks like us. I am a 16 year old high school student with an already successful “career” in the Biological sciencesbut a terrible interest in the Nuclear Dilemma. It seems as though I’m not alone in this strong, but unprofessional hobby. To be honest, I would say that about a quarter of the views on that chart are all me 🙂
I use your platform almost every day. I just want to thank you for creating and continueing to further such awesome platforms as yours 🙂
Thanks,
Josh
Alex, have you considered having Nukemap model the thermal effect of detonations to cause fires, in addition to injury? I’ve been reading “Whole World on Fire: Organisations, Knowledge, and Nuclear Weapons Devastation” by Lynn Eden.
Yes. I am working on a project (it is behind at the moment, but well under way) that involves dealing with issues of burning from a few perspectives.