When I created the NUKEMAP in 2012, the Google Maps API was amazing. 1 It was the best thing in town for creating Javascript mapping mash-ups, cost literally nothing, had an active developer community that added new features on a regular basis, and actually seemed like it was interested in people using their product to develop cool, useful tools.
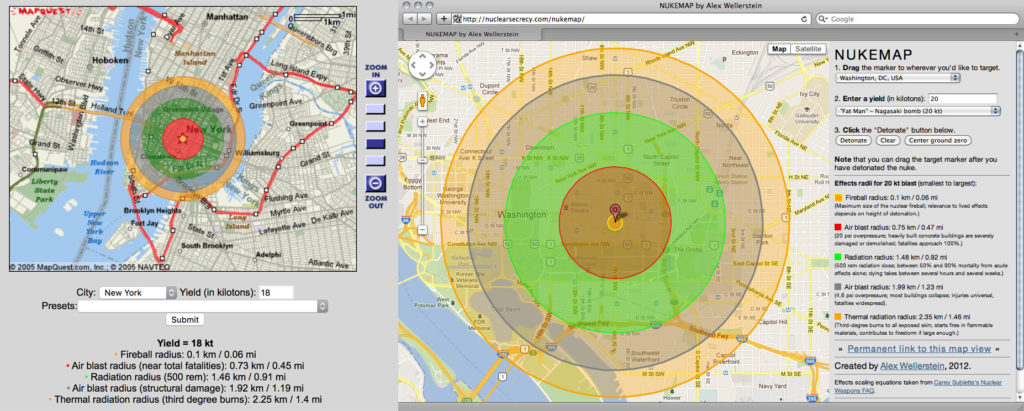
NUKEMAPs of days gone by: On the left is the original NUKEMAP I made way back in March 2005, which used MapQuest screenshots (and was extremely limited, and never made public) and was done entirely in PHP. I made it for my own personal use and for teaching. At right, the remade original NUKEMAP from 2012, which used the Google Maps API/Javascript.
Today, pretty much all of that is now untrue. The API codebase has stagnated in terms of actually useful features being added (many neat features have been removed or quietly deprecated; the new features being added are generally incremental and lame), which is really quite remarkable given that the Google Maps stand-alone website (the one you visit when you go to Google Maps to look up a map or location) has had a lot of neat features added to it (like its 3-D mode) that have not been ported to the API code (which is why NUKEMAP3D is effectively dead — Google deprecated the Google Earth Plugin and has never replaced it, and no other code base has filled the gap). 2
But more importantly, the changes to the pricing model that have been recently put in place are, to put it lightly, insane, and punishing if you are an educational web developer that builds anything that people actually find useful.
NUKEMAP gets around 15,000 hits a day on a slow day, and around 200,000 hits a day per month, and has done this consistently for over 5 years (and it occasionally has spikes of several hundred thousand page views per day, when it goes viral for whatever reason). While that’s pretty impressive for an academic’s website, it’s what I would call “moderately popular” by Internet terms. I don’t think this puts the slightest strain on Google’s servers (who also run, like, all of YouTube). And from 2012 through 2016, Google didn’t charge a thing for this. Which was pretty generous, and perhaps unsustainable. But it encouraged a lot of experimentation, and something like NUKEMAP wouldn’t exist without that.
In 2016, they started charging. It wasn’t too bad — at most, my bill was around $200 a month. Even that is pretty hard to do out-of-pocket, but I’ve had the good fortune to be associated with an institution (my employers, the College of Arts and Letters at the Stevens Institute of Technology) that was willing to foot the bill.
But in 2018, Google changes its pricing model, and my bill jumped to more like $1,800 per month. As in, over $20,000 a year. Which is several times my main hosting fees (for all of my websites).
I reached out to Google to find out why this was. Their new pricing sheet is… a little hard to make sense of. Which is sort of why I didn’t see this coming. They do have a “pricing calculator,” though, that lets you see exactly how terrible the pricing scheme is, though it is a little tricky to find and requires having a Google account to access. But if you start playing with the “dynamic map loads” button (there are other charges, but that’s the big one) you can see how expensive it gets, quickly. I contacted Google for help in figuring all this out, and they fobbed me off onto a non-Google “valued partner” who was licensed to deal with corporations on volume pricing. Hard pass, sorry.
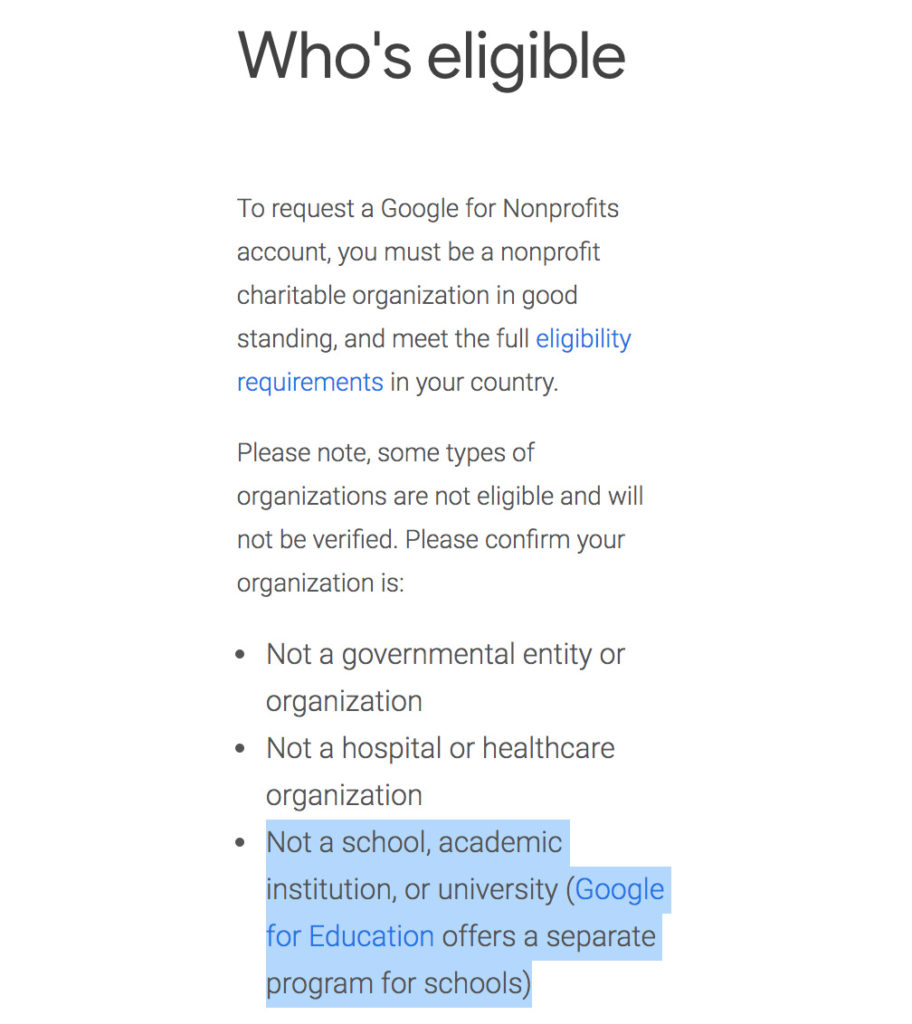
Google for Nonprofit’s eligibility standards — academics need not apply.
I know that Google in theory supports people using their products for “social causes,” and if one is at a non-profit (as I am), you can apply for a “grant” to defray the costs, assuming Google assume’s you’re doing good. I don’t know how they feel about the NUKEMAP, but in any case, it doesn’t matter: people at educational institutions (even not-for-profit ones, like mine) are disqualified from applying. Why? Because Google wants to capture the educational market in a revenue-generating way, and so directs you to their Google for Education site, which as you will quickly find is based on a very different sort of model. There’s no e-mail contact on the site, as an aside: you have to claim you are representing an entire educational institution (I am not) and that you are interested in implementing Google’s products on your campus (I am not), and if you do all this (as I did, just to get through to them) you can finally talk to them a bit.
There is literally nothing on the website that suggests there is any way to get Google Maps API credit, but they do have a way to request discounted access to the Google Cloud Platform, which appears to be some kind of machine-learning platform, and after sending an e-mail they did say that you could apply for Google Cloud Platform funds to be used for Google Maps API.
By which point I had already, in my heart, given up on Google. It’s just not worth it. Let me outline the reasons:
- They clearly don’t care about small developers. That much is pretty obvious if you’ve tried to develop with their products. Look, I get that licensing to big corporations is the money-maker. But Google pretends to be developing for more than just them… they just don’t follow through on those hopes.
- They can’t distinguish between universities as entities, and academics as university researchers. There’s a big difference there, in terms of scale, goals, and resources. I don’t make university IT policy, I do research.
- They are fickle. It’s not just the fact that they change their pricing schemes rapidly, it’s not just that they deprecate products willy-nilly. It’s that they push out new products, encourage communities to use them to make “amazing” things, and then don’t support them well over the long term. They let cool projects atrophy and die. Sometimes they sell them off to other companies (e.g., SketchUp), who then totally change them and the business model. Again, I get it: Google’s approach is throwing things at the wall, hoping they stick, and believes in disruption more than infrastructure, etc. etc. etc. But that makes it pretty hard to justify putting all of your eggs in their basket.
- I don’t want to worry about whether Google will think my work is a “social good,” I don’t want to worry about re-applying every year, I don’t want to worry about the branch of Google that helps me out might vanish tomorrow, and so on. Too much uncertainty. Do you know how hard it is to get in contact with a real human being at Google? I’m not saying they’re impossible — they did help me waive some of the fees that came from me not understanding the pricing policy — but that took literally months to work out, and in the meantime they sent a collection agency after me.
But most of all: today there are perfectly viable alternatives. Which is why I don’t understand their pricing model change, except in terms of, “they’ve decided to abandon small developers completely.” After a little scouting around, I decided that MapBox completely fit the bill (and whose rates are more like what Google used to charge), and that Leaflet, an open-source Javascript library, could make for a very easy conversion. It took a little work to make the conversion, because Leaflet out of the box doesn’t support the drawing of great circles, but I wrote a plugin that does it.
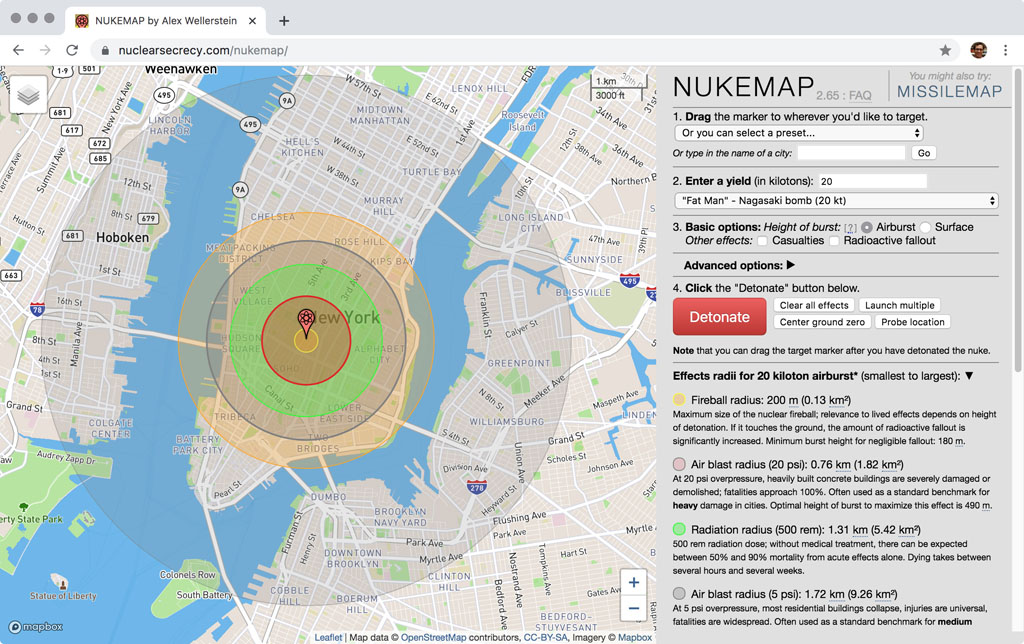
NUKEMAP as of this moment (version 2.65; I make small incremental changes regularly), with its Mapbox GL + Leaflet codebase. Note that a while back I started showing the 1 psi blast radius as well, because I decided that omitting it caused people to underestimate the area that would be plausibly affected by a nuclear detonation.
Now, even MapBox’s pricing scheme can add up for my level of map loads, but they’ve been extremely generous in terms of giving me “credits” because they support this kind of work. And getting that worked out was a matter of sending an e-mail and then talking to a real person on the phone. And said real person has been extremely helpful, easy to contact, and even reaches out to me at times when they’re rolling out a new code feature (like Mapbox GL) that he thinks will make the site work better and cheaper. Which is to say: in every way, the opposite of Google.
So NUKEMAP and MISSILEMAP have been converted entirely over to MapBox+Leaflet. The one function that wasn’t easy to port over was the “Humanitarian consequences” (which relies on Google’s Places library), but I’ll eventually figure out a way to integrate that into it.
More broadly, the question I have to ask as an educator is: would I encourage a student to develop in the Google Maps API if they were thinking about trying to make a “break-out” website? Easy answer: no way. With Google, becoming popular (even just “moderately popular”) is a losing proposition: you will find yourself owing them a lot of money. So I won’t be teaching Google Maps in my data visualization course anymore — we’ll be using Leaflet from now on. I apologize for venting, but I figured that even non-developers might be interested in knowing on how these things work “under the hood” and what kinds of considerations go into the choice of making a website these days.
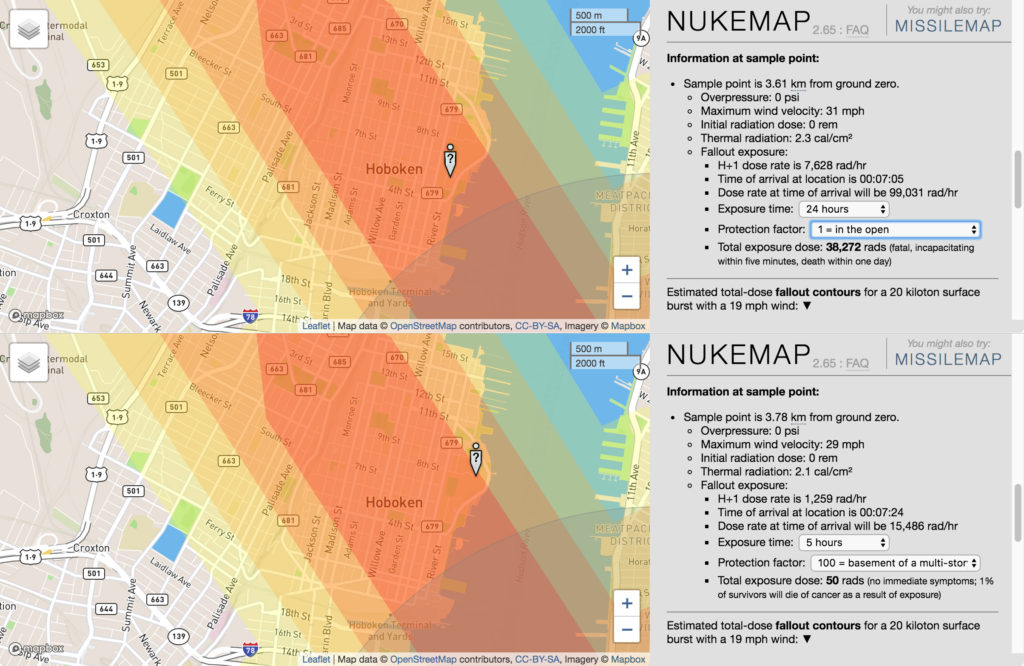
A simple example of the kind of thing you can do with NUKEMAP’s new fallout dose exposure tool. At top, me standing out my office (for an entire 24 hours) in the wake of a 20 kt detonation in downtown NYC using the weather conditions that exist as I am posting this: I am very very dead. At bottom, I instead run quickly into the basement bowling alley in the Stevens University Howe Center (my preferred shelter location, because it’s fairly deep inside a multi-story rocky hill, on top of which is a 13 story building), and the same length of time gives me, at most, a slight up-tick in long-term cancer risk.
More positively, I’m excited to announce that a little while back, I added a new feature to NUKEMAP, one I’ve been wanting to implement for some time now. The NUKEMAP’s fallout model (the Miller model) has always been a little hard to make intuitive sense out of, other than “a vague representation of the area of contamination.” I’ve been exploring some other fallout models that could be implemented as well, but in the meantime, I wanted to find a way to make the current version (which has to advantage of being very quick to calculate and render) more intuitively meaningful.
The Miller model’s contours give the dose intensity (in rad/hr) at H+1 hour. So for the “100 rad/hr” contour, that means: “this area will be covered by fallout that, one hour after detonation, had an intensity of 100 rad/hr, assuming that the fallout has actually arrived there at that time.” So to figure out what your exposure on the ground is, you need to calculate when the fallout actually arrives to you (on the wind), what the dose rate is at time of arrival, and then how that dose rate will decrease over the next hours that you are exposed to it. You also might want to know how that is affected by the kind of structure you’re in, since anything that stands between you and the fallout will cut your exposure a bit. All of which makes for an annoying and tricky calculation to do by hand.
So I’ve added a feature to the “Probe location” tool, which allows you to sample the conditions at any given distance from ground zero. It will now calculate the time of fallout arrival (which is based on the distance and the wind settings), the intensity of the fallout at the time of arrival, and then allow you to see what the total dose would be if you were in that area for, say, 24 hours after detonation. It also allows you to apply a “protection factor” based on the kind of building you are in (the protection factor is just a divisor: a protection factor of 10 reduces the total exposure by 10). All of which can be used to answer questions about the human effects of fallout, and the situations in which different kinds of shelters can be effective, or not. 3
There are some more NUKEMAP features actively in the works, as well. More on those, soon.
- For non-coders: an API is a code library that lets third-party developers use someone else’s services. So the Google Maps API lets you develop applications that use Google Maps: you can say, “load Google Maps into this part of the web page, add an icon to it, make the icon draggable, and when someone clicks a button over here, draw circles around that icon that go out to a given radius, and color the circles this way and that way.” That’s the basics of NUKEMAP’s functionality, more or less.[↩]
- Before people e-mail me about how CesiumJS fills the Google Earth Plugin gap — it doesn’t, because it doesn’t give you the global coverage of 3D buildings that you need to make sense of the size of a mushroom cloud. If they change that someday, I’ll take the time to port the code, but I don’t see many signs that this is going to happen, because global 3D building shapes are still something that only Google seems to own. If you do want to render volumetric mushroom clouds in the stand-alone Google Earth program, there is a (still experimental and incomplete) feature in NUKEMAP for exporting cloud shapes as KMZ files. See the NUKEMAP3D page for more information on how to use this.[↩]
- I’ll eventually update the NUKEMAP FAQ about how this works, but it just uses Wigner’s standard t-1.2 fission product decay rate formula.[↩]


Alex, the job you’re doing is amazing and is helping a lot of people worldwide that want to so researches on nuclear war and its effects. Thank you for standing against the flow – which would be making this tools not free – and having such efforts to make all of this happen.
(Clearly I’m not a native English speaker, but I just wanted to leave some kind of message!)
Thanks for using a proper attribution for OpenStreetMap data!
(Mapbox is using OpenStreetMap as source for data of its maps)
(I am one of many OSM mappers and I am happy that is used as part of this great tool!)
Thanks Alex — we’re happy to support your work at Mapbox. And if anyone else working on impactful projects like this, no matter your affiliation, needs help on the accounts or tech side, you can reach the humans of the Mapbox Community team at https://www.mapbox.com/community/
Thank you Alex for all your effort in making digital map more accessible for community and human beings. Thank you Mikel for offering helps. Mapbox is an awesome company and their library’s algorithms (R-tree, Concave Hull, etc. at least I know) are incredible.
I am one of OSM mappers and I am happy to see that result of our mapping is used in this way!
Also thanks for properly attributing OpenStreetMap contributors.
« It took a little work to make the conversion, because Leaflet out of the box doesn’t support the drawing of great circles, but I wrote a plugin that does it. »
Why not using a “circleMarker”, that does exactly this, and is supported out of the box?
Aside from the fact that circleMarker uses pixels as measurement (not meters, etc.), I’m not at all sure it does great circles (the default Circle object does not — it draws perfectly round circles, which are not radii on a globe). NUKEMAP’s circles are easily large enough at certain latitudes for this difference to be apparent, but MISSILEMAP in particular will not work without great circle paths.
Thanks for the article. Are you able to share what approx charges you’re looking at with Mapbox vs. Google when looking at similar traffic as when you were charged $1,800/mo with Google?
And does that include their credits? Are you able to provide the amount as if you weren’t provided any credits?
I’m not 100% sure what the Mapbox price would be without the credits — it has varied a bit because of different ways they’ve been implementing both their API (their shift to Mapbox GL changed things a lot, esp. for NUKEMAP, because an entirely tile-based approach leads NUKEMAP to be very expensive, whether as load-based approach does not — this is because people who use NUKEMAP tend to visit a lot of places with it, as opposed to staying on one map) and their pricing scheme (which recently changed in a way that in principle should be even better for NUKEMAP). But more importantly, they’ve been willing to work with me on this (very actively, over the course of months) to come up with an approach that works well on their end as well as mine, and they’ve been willing to essentially set a monthly budget and work the credits around that. So despite the fact that I don’t always understand how their billing works, the end result is that I’ve gotten very good help from them.
So, did you think about OpenStreetMap as well and which reasons were there for not choosing it?
OSM provides good data, but it is not meant to be a tile server for a production product, and their terms of service prohibit the kind of bandwidth that NUKEMAP would require. (Mapbox uses OSM data.) I could presumably serve my own OSM-derived tiles off of my webserver, but this would not only take considerable setup (it’s not easy to get it all working well, much less maintain it), but also cost me an unknown amount of money in extra server costs. I consider looking into this the “nuclear option” (so to speak!) because of the amount of work it would require prior to me knowing whether it was financially sustainable or not (because it’s not easy to estimate the costs of the bandwidth).
Hi Alex:
As a developer, I have too ported to alternate options instead of Google’s API’s. Please gives us an update if GOOG decides to contact you and offer you some explanation or try to convince you to go back.
Not that I would hold by breath.
I’ve never gotten the impression that they know I exist, or care about this sort of thing. Too big to fail, too big to care…
I have a slide lecture which was on Picasaweb until Google shut down Picasa and moved everything into Google Photos
https://get.google.com/albumarchive/115730360141680496457/album/AF1QipOCk4SzD0vP-Q970k-ZB8ZxJ8WafHgAUT7JKuNG
The only problem is that Google Photos doesn’t have a sort feature, which means it is useless for organizing a slide lecture. I thought Google had a motto: don’t be evil.
While I’m not sure discontinuing old products counts as “evil,” I will note that many people have pointed out there is an important linguistic distinction between “don’t be evil” and “don’t do evil.” Practically no one who does evil thinks they are evil.