I was somewhat surprised to realize that today is the 10th anniversary of my unveiling of NUKEMAP. Historians should not be surprised by the passing of time, but people are, and historians are people, so, well, here I am, continually surprised.
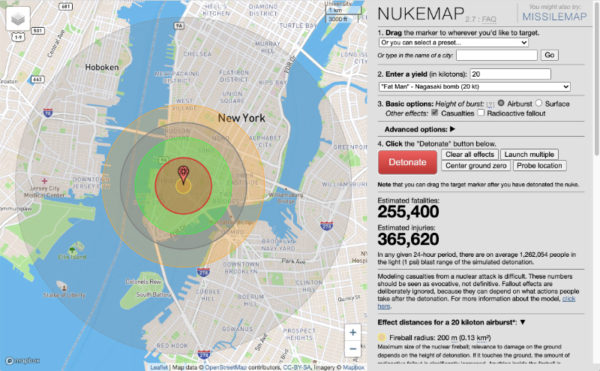
NUKEMAP as it looks at the moment. You can see some previous iterations in this post.
The most disturbing effect of the passing of time with NUKEMAP has been the slightly different ways in which people talk to me about having used it. After a couple of years, I started to get people coming up to me and saying, “I used NUKEMAP when I was an undergraduate,” which wasn’t so bad, since said people were generally in graduate school. But now I get people who tell me they used NUKEMAP in elementary school, and the people telling me this are not in middle school, but look like adults. Which on the one hand makes me feel great — like I’m having an impact in this world — but on the other hand makes me feel old, because of course to me it still feels like I just created this site “the other day.”
I’m not going to write a long post reflecting on how I feel about the site, because I did that five years ago and my thoughts haven’t really changed. I still have things I’d like to add to it, and I’m still working on it pretty regularly, but as I wrote recently in reflecting on 10 years of blogging, I never have quite enough time to get all the things done I’d like. But some things that have been in the works for the last couple of years, which should come to fruition sometime in the next year include:
- 1a localization project so that NUKEMAP can be translated into languages other than English (in principle easy to do, in practice just very time consuming)
- much better mobile support for NUKEMAP (this is almost done)
- a means for calculating the possible areas of fire burn based on terrain type (this has been in the works for years but last summer a student working with me made huge progress on it)
- one of several means of visualizing 3D mushroom clouds again (variants of the NUKEMAP3D concept; a team of students is currently working on one of these, and I have another quick-and-dirty approach I am thinking of trying to implement)
- a dynamic fallout model so you can see the fallout plume grow and decay over time (a team of students working for me last summer made great progress on this front, but I’d need to really sit down with it for awhile to get it ready to deploy)
There are also some little tweaks to the underlying effects model I’ve been meaning to make (the prompt radiation curve gets out of whack at some yields, it’d be nice to have something related to underground or underwater detonations; the mushroom cloud to KMZ export has some little annoying bugs in it).
The main thing not in the works that I get asked about all the time is support for EMP effects, and that is because a) there are no open-source models of EMP effects that I have been able to find that allow you to draw useful visualizations of them (if anyone knows of one, let me know, but I’ve looked for years), and b) even if I could draw a nice HEMP SMILE diagram for a nuke at arbitrary yield and arbitrary height of burst, it’s nontrivial to translate those visualizations into meaning for people, and this is an area that is so fraught with political implications and technical disagreements/uncertainty that I am a little hesitant to go into it (I am not an EMP alarmist, but I also don’t think it would be nothing, and finding a model that would let me convey the lived reality of it is difficult). This could change in the future, depending on what is out there and how I feel about it, but I don’t have any ongoing plans to dip my toe into this debate right now (I revisit this question about once a year, for what it is worth).
One thing that I’ve been meaning to do for years (“when I get some time,” ha), is to do a more comprehensive analysis of NUKEMAP usage behaviors and make that data easily accessible. This anniversary snuck up on me, so I haven’t been able to roll that out today. But here’s a little sample of some of that data.
NUKEMAP collects two kinds of different statistics of users. First, just the basic demographic information and page usage information that Google Analytics provides (which is useful but very “high level”). Second, unless you disable it, every detonation a user make is logged into a gigantic database, including some information about the user (e.g., if it can, it will try to figure out from a user’s IP address what country they are in). All geographical data is fuzzed by enough that I can’t tell exactly where nukes are aimed (I trim enough off of the latitudes and longitudes that I can see basic areas but not specific buildings), and I don’t keep any user-identifiable information (IP addresses are not logged). The resulting data is pretty interesting, but at this point there’s a LOT of it — there have been about 220 million detonations. That’s a large-enough dataset that even manipulating the data can take awhile, but I’m in the process of having a machine crunch it down into usable pieces so I can actually do some analysis of it.
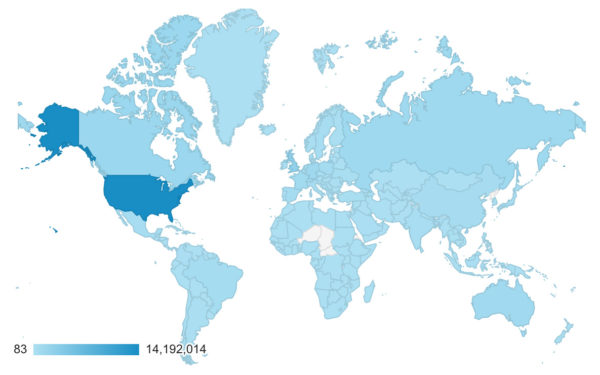
But here are a few little samples. Who uses NUKEMAP? Pretty much every nation with an outgoing internet connection has had at least one visitor to NUKEMAP, which is a little amazing and overwhelming, even more so since NUKEMAP is in English (obviously there are ways to translate websites on the fly, but it’s an obvious impediment). The top users are Americans, no surprise there, but the list from then on is interesting. Here are the top 10 countries by NUKEMAP users:
- United States of America, 14.2 million users (34% of total)
- United Kingdom, 2.4 million (7.5%)
- Canada, 1.4 million (4.4%)
- Germany, 1.1 million (3.5%)
- Russia, 1.1 million (3.3%)
- Australia, 977K (3%)
- France, 856K (2.6%)
- Poland, 633K (1.9%)
- Spain, 582K (1.8%)
- Brazil, 572K (1.8%)
At one point, Google Analytics said it had been visited at least once from North Korea, but now it seems to be not so sure. I’ve no idea how accurate something like that could be, of course. It’s a little amusing to imagine Kim Jong-Un using it; hopefully he’d look at it and say, “gosh, let’s avoid having this happen.”
The oddest “use stories” I get are from people who do work in various aspects of the US government, military, or nuclear complex who tell me that they like to use it to “play around” with things that don’t feel “right” to do on official government software. I take that as high praise, even if it does present certain uncomfortable aspects!
What are the most popular yields of weapons that people test? It probably comes as no surprise who the King of the Bombs is — the Tsar Bomba’s maximum design yield (100 Mt) is by far the most popular yield, with over 81 million simulations by itself (37% of the total detonations). After that, it gets much more equitable, at least among the preset options, which (with two exceptions) are the most popular individual yield choices: the 50 Mt Tsar Bomba gets 5% (11.9 million), 20 kt (Fat Man and Nagasaki) also is 5% (9.9 million), 15 kt (Hiroshima) gets 4% (9.3 million), and the Davy Crockett (20 tons) gets 4% (9 million). None of that is super surprising based on why and how people use NUKEMAP: the two World War II yields (NUKEMAP always gets a lot of traffic around the anniversaries), the Tsar Bomba (biggest bomb), and the Davy Crockett (smallest bomb) look a whole lot like what I see when I ask people what they do with NUKEMAP (trying the biggest, the largest, the known). After these ones you get a dwindling percentage for each yield in the preset list, down to the least popular, 300 tons (B61 mod 3), which gets a little over a million uses. The only two yield settings that get higher than a million and are not in the preset list are 1 kt and 10 kt — which is not super surprising, either.
All together, the preset options make up 92% of what people try when they use NUKEMAP. That 8% of “non-preset” NUKEMAP can be pretty wild, though; people try lots of weird numbers, the purpose of which I cannot really guess. Most of them are either nice round numbers (e.g., 3800, or 40), which sort of makes sense, and some of them are just-off from round numbers (99,999), which might be experimentation (what’s a kiloton, between friends?). With such a large number of users, even a tiny bit of spontaneous experimentation means a lot of uses — 27,362 people each tried 99 kilotons. Over 19,000 people opted for more obvious symbolism of 666 kt.
The most interesting to me are trends about who nukes who. These are harder to get at, because while it is easy to figure out the target of a NUKEMAP nuke (it’s whatever latitude and longitude the user chooses), it’s trickier to accurately get information about where the user is located, especially since I am trying to avoid anything that would compromise their privacy (people are already “spooked” by nuclear topics, and a frequent comment about NUKEMAP online is that if you use it, you’ll be “on a list” — if so, then we’re all on the list).
There was a period in which this kind of anonymized user location data was provided easily by Google, and then that got very unreliable for awhile, and only in the last few years was I able to once again start getting that data again (using an IP address lookup table function I wrote), but even that is not entirely accurate (because people can use VPNs, and IP lookup tables can be inaccurate or go out of date). I wasn’t able to get the database to collate that data in time for this blog post (the dataset is big and not indexed, so it can take hours to run big queries — this is fixable, of course, but not in the span of an hour or two). So look for that in the near future. In the past, it has had some interesting patterns regarding how people in some countries use NUKEMAP to model attacks on other countries.
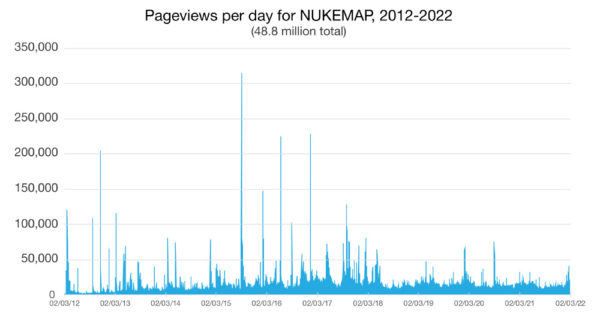
NUKEMAP still pulls in a respectable number of hits per day on a slow day — on the order of 10,000 or so. On a “viral” day that can kick up an order of magnitude, and those still happen (as I write this, there are a bunch of “what would happen if we got nuked?” articles going around for cities in Scotland), though it has been awhile since it had a “super viral” day of over 100,000 visitors. More views equal more education, but the cost of operation also scales pretty linearly as well. So I’m extremely grateful to the organizations that make the financial aspects of NUKEMAP possible: Mapbox for giving me a decent educational/humanitarian discount for the tile services; Global Zero for stepping in and picking up the server bills when my previous source dried up due to COVID belt-tightening, and the admins (esp. my dean, Kelland Thomas) at the Stevens Institute of Technology who consider this work a core part of my research and scholarship (which an outsider might take for granted, but any university professor knows is something to be appreciated!).
As always, more soon…!



The oddest “use stories” I get are from people who do work in various aspects of the US government, military, or nuclear complex who tell me that they like to use it to “play around” with things that don’t feel “right” to do on official government software. I take that as high praise, even if it does present certain uncomfortable aspects!
There are probably multiple aspects to that.
1.) The whole “born secret” aspect of using official government software. If you use that software, you can’t talk about the results it gave you over lunch with people, whereas with NUKEMAP, you can talk about it all day without having to worry over clearance levels.
2.) I would imagine in the last decade or so, ever since Snowden; tracking of what people do on government computers has exploded — and people don’t want to get asked uncomfortable questions by their security minders like:
“Why did you use Weapon Effects v9.1 to see what a 200 kt modern high yield warhead would do to downtown Stockholm?”
So, it’s a single use case – but I almost always nuke my own house.
Mostly I’m trying to visualise just what the destruction caused would be and how far out the effects would be, in a format I can directly relate to.
Yeah, a lot of people nuke their own houses. I think it’s kind of funny, since almost nobody’s house (except maybe the head of states’) is likely to be an actual target! I always recommend (if people are thinking about NUKEMAP’s utility in telling them what might happen to them in an attack) to attack something nearby that might be a plausible target. And then wonder how much a given nuke might miss… 🙂