Visualizations
I enjoy creating new visualizations for matters related to nuclear history and nuclear security. Since it can be hard to find these scattered throughout my blog posts, I have collected some of them here:
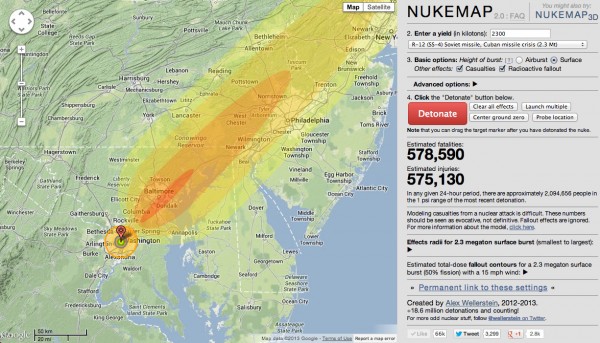
NUKEMAP — nuclear weapons effects simulator for Google Maps (more information)
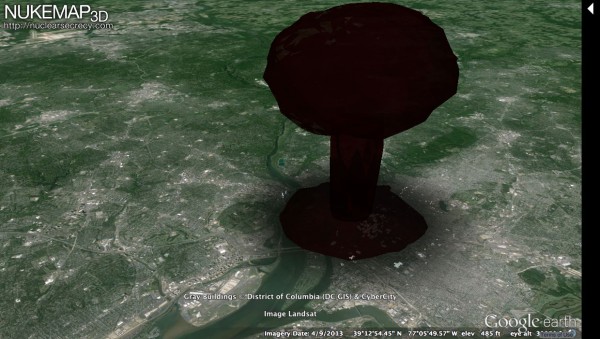
NUKEMAP3D — nuclear weapons effect simulator for Google Earth (more information)
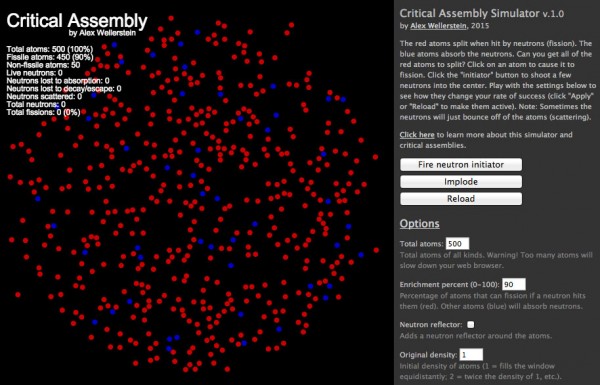
Critical Assembly Simulator — interactive visualization of the concept of “critical mass” (more information)
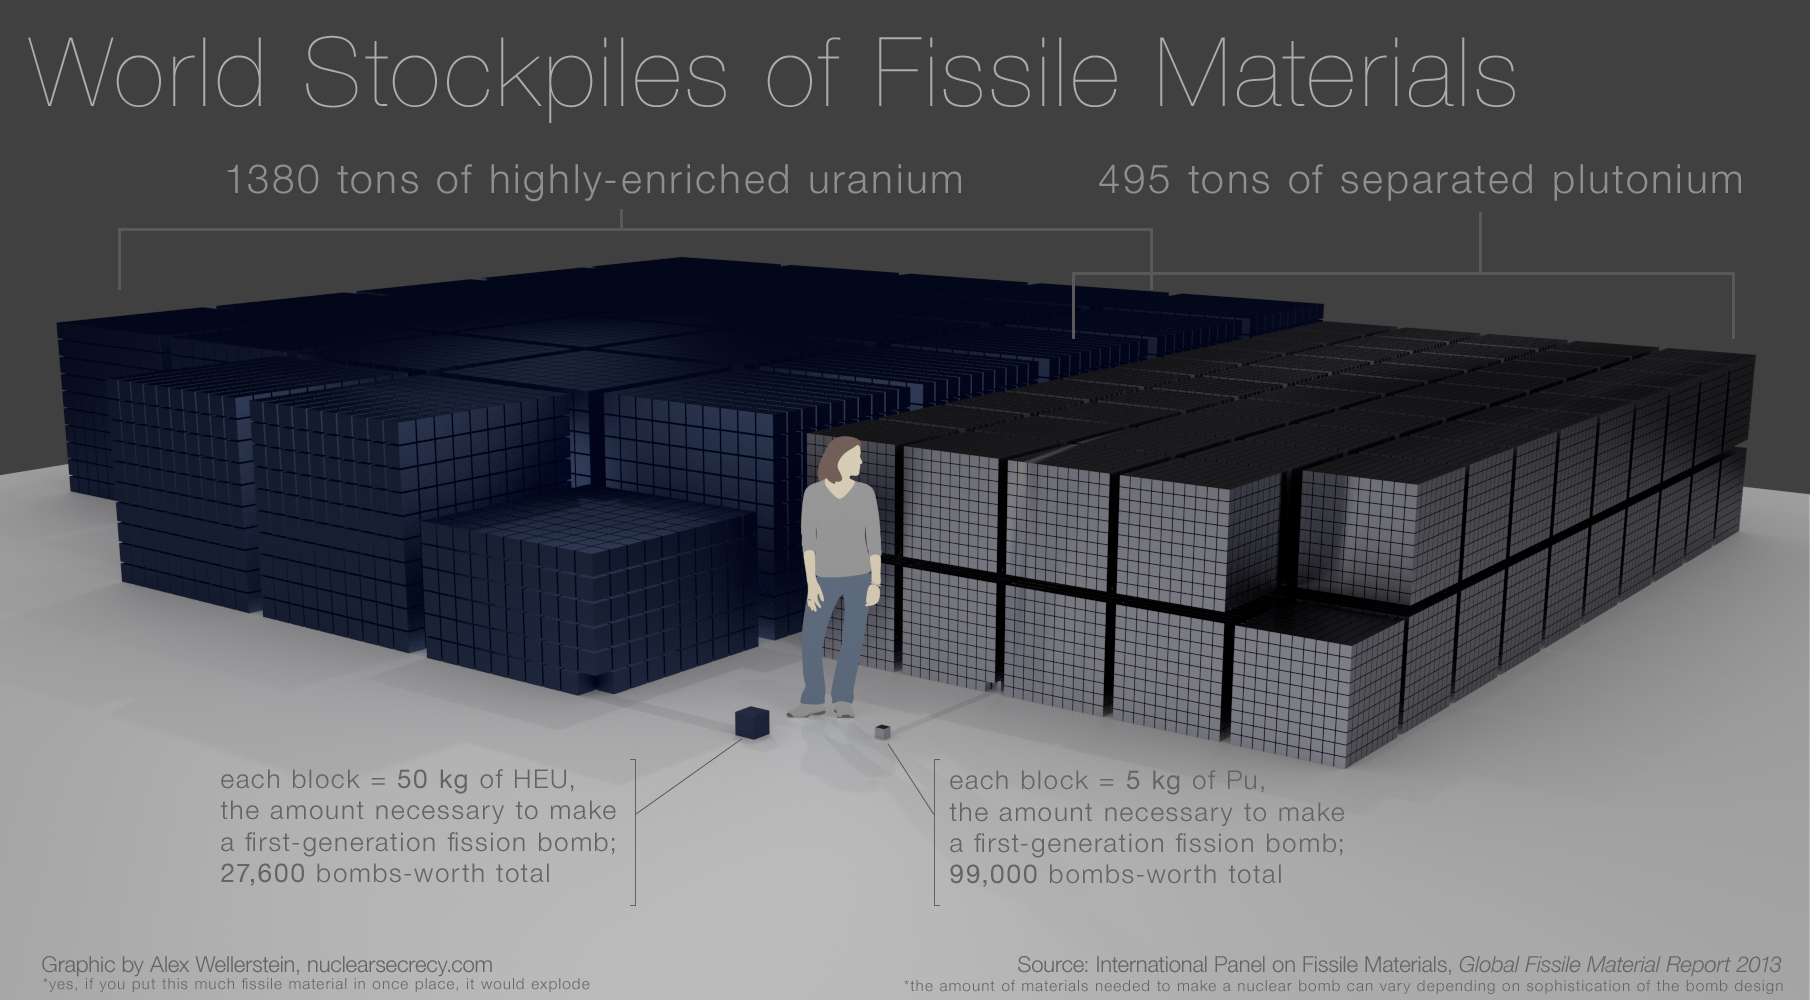
World Stockpiles of Fissile Material — static rendering of the volume taken up by the amount of enriched uranium and separated plutonium in the world, broken into bomb-sized chunks (more information)
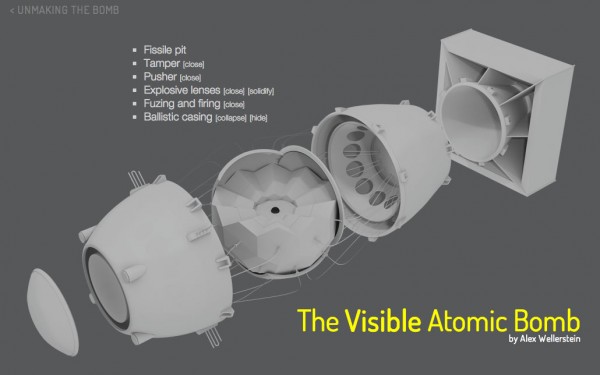
The Visible Atomic Bomb — interactive Fat Man-style bomb that allows you to see the various components as semi-transparent layers (more information)

Faces of Project Y — Los Alamos badge photographs arranged as a massive, interactive mosaic (more information)
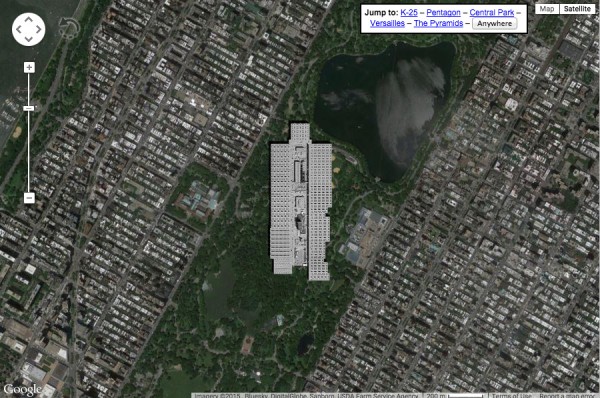
How big was K-25? — representing the size of the largest single Manhattan Project facility (more information)
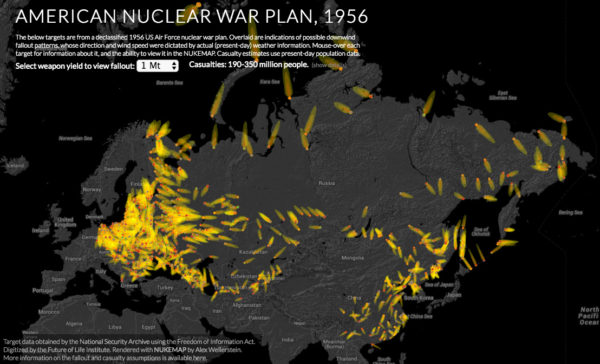
American Nuclear War Plan, 1956 — visualizing the targets and effects of a declassified US nuclear war target list from 1946 (more information)