Meditations

Major Bong’s Last Flight

by Alex Wellerstein, published August 6th, 2013

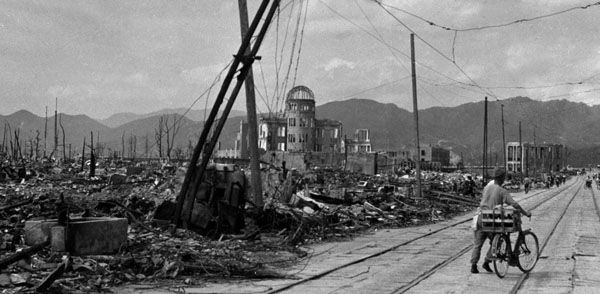
On the morning of August 6th, 1945 — 68 years ago today — the “Little Boy” atomic bomb was dropped on Hiroshima, Japan, by the American B-29 bomber, the Enola Gay.

Hiroshima in late 1945

In the last year, I’ve written about the bombing of Hiroshima quite a bit on here already in many different modes:

68 years later and we’re still grappling with the meaning of that legacy. We’re still debating it, still arguing about it, still researching it. It seems like one of those issues that will be hotly contested as long as people feel they have some stake in the outcome. As the generation that lived through World War II passes into history, I wonder how our views on this will evolve. Will they become more detached from the people and the events, and will that result in more hagiography (“Greatest Generation,” etc.) or its opposite? It will be interesting to see, in the decades to come.

Historical memory is skittish in its attentions. Our understanding of what was important about the present and past changes rapidly. Neal Stephenson, one of my favorite science fiction authors, has a wonderful conceit in his novel Anathem, whereby one group of scholars writes a history of their times once a year and then, every decade, forward it on to another group of scholars. They pare them down to the things that still seem important, and then, every century, forward ten of those on to another group of scholars. Those scholars (who are essentially isolated from all other news of the world) then pare out everything out that no longer seems important, and every thousand years, forward on their histories to another isolated group. I find this a wonderful illustration of the paring that time has on our understanding of the past, and how much that once seems so important is soon viewed as irrelevant.

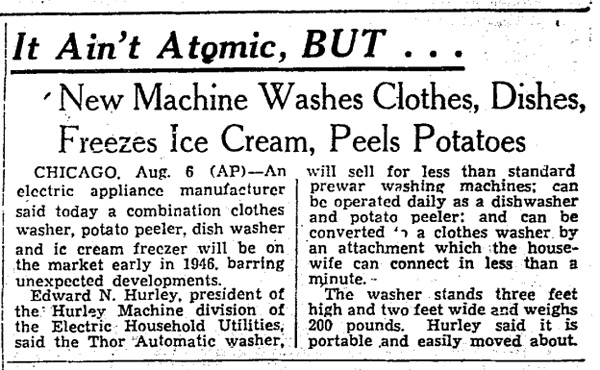
One need only look through the newspapers that broke the news of Hiroshima (that is, those from August 7th, 1945, because of time zones and deadlines for morning editions) to see how much this is the case. Not all are as blatant as this sad tie-in from The Boston Daily Globe (August 7, 1945, page 4):

1945-08-07 - Boston Globe - Washing Machine

In defense of whomever chose that headline, they had to fill page space, and it’s clear they recognized how insipid this “new machine” was when nestled amongst war news. But there are other story decisions that are in some ways much more striking in retrospect.

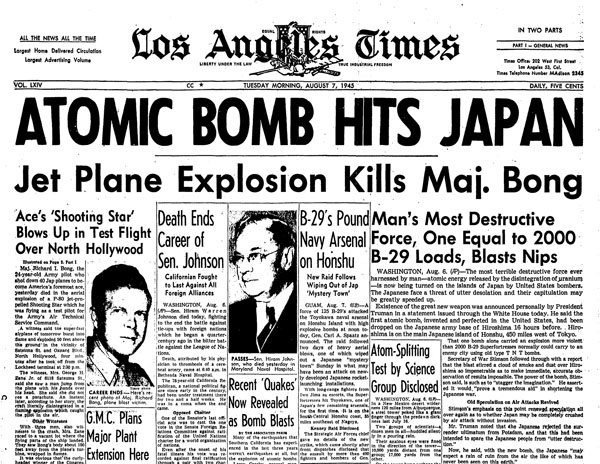
Take, for example, the headlines above the fold of the Los Angeles Times (August 7):

1945-08-07 - Los Angeles Times front page

Most of the headlines are devoted to the atomic bomb. Most of those about the bomb itself are either verbatim copies of, or derived from, the press releases and stories distributed by the Manhattan Project’s Public Relations Organization (yes, they had such a thing!). The one bomb story on there that is not from there is, tellingly, completely incorrect: a report that earthquakes in Southern California from the past three years were “the explosions of atomic bombs.” Um, not exactly. (There were large tests of chemical explosives at the Navy’s China Lake facility in Southern California, as part of Project Camel, but no atomic bomb tests out there, obviously.) The other big stories of the day are two deaths. One was of the Senator Hiram Johnson, an isolationist who bitterly opposed American foreign entanglements — there’s something appropriate with him passing away just as the United States was entering into a new era of such.

The other was the death of Major Richard Bong, a death so important at the time that its headline is only a tiny bit smaller than the news of Hiroshima itself. As the article explains, Richard I. Bong was a 24-year-old fighter pilot, the highest-scoring U.S. fighter ace of World War II, having shot down at least 40 confirmed Japanese planes. He died on familiar soil, as a test pilot in North Hollywood. His plane, an experimental P-80 Shooting Star, the United States’ first jet fighter, exploded a few minutes after takeoff. Bong attempted to abandon the plane, but it exploded and killed him.

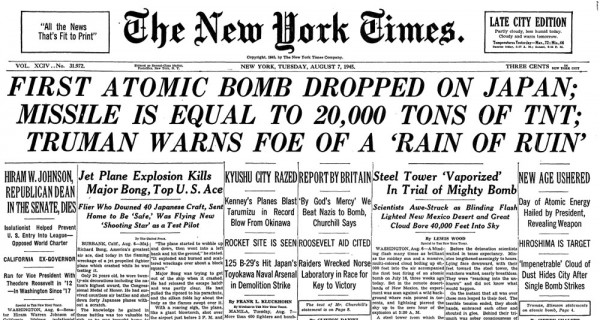
Major Bong’s death got front billing in all of the major national newspapers. It was understandably most prominent in Los Angeles, where it was local news. But even the venerable New York Times, who had some of the thickest bomb coverage on account of their Manhattan Project-embedded reporter, William L. Laurence, slipped him on there, at the top, in the same size headline that they described the Trinity test:

1945-08-07 - New York Times headlines

Today, practically nobody has heard of Major Bong. I occasionally bring him up as an example of how many of the top news stories of today are going to be unheard of in a few years. The reaction I usually get is disbelief: 1. Surely “Major Bong” is a made-up name, and 2. Really, he shared the headlines with Hiroshima?

One gets this sensation frequently whenever one looks through the newspapers of the past. When my wife teaches her high school students about World War II, she prints out front pages of newspapers for various “famous events” of the day and has her students look at them in their entirety. It’s a useful exercise, not only because it makes the past feel real and relatable (hey, they wrote puff stories about new, dumb inventions, too!), but because it also emphasizes how disconnected the front pages of a newspaper might be with how we later think about a time or event, or with the later evaluation of a President, or with an understanding of a war. It is an exercise that also illustrates how a careful understanding of the past encourages a careful understand of the present — what story of today will be the Major Bong of tomorrow? And who is to say that Major Bong’s story shouldn’t be better known, and less overshadowed by other events of the time? There is nothing like steeping yourself in the news of a past period, to see how both strange and familiar it is, and to see how the grand and the mundane were always intermingled (as they are clearly today).

Personally, while I think Hiroshima is worth talking about — obviously — I think we put perhaps too much emphasis on it, and doing so remove it from its context. Other headlines on the same day talk about other bombing raids, including firebombing raids — the broader context of strategic bombing, and the targeting of civilians, of which the atomic bombs were only a part. I think, on the anniversary of Hiroshima, we should of course think about Hiroshima. But let’s not forget all of the other things that happened at that time — even on the same day — that get overshadowed when we hold up one event above all others.
Meditations | Visions

What the NUKEMAP taught me about fallout

by Alex Wellerstein, published August 2nd, 2013

One of the most technically difficult aspects of the new NUKEMAP was the fallout generation code. I know that in practice it looks like just a bunch of not-too-complicated ellipses, but finding a fallout code that would provide what I considered to be necessary flexibility proved to be a very long search indeed. I had started working on it sometime in 2012, got frustrated, returned to it periodically, got frustrated again, and finally found the model I eventually used — Carl Miller’s Simplified Fallout Scaling System — only a few months ago.

The sorts of contours the Miller model produces.

The sorts of contours the Miller scaling model produces.

The fallout model used is what is known as a “scaling” model. This is in contrast with what Miller terms a “mathematical” model, which is a much more complicated beast. A scaling model lets you input only a few simple parameters (e.g. warhead yield, fission fraction, and wind speed) and the output are the kinds of idealized contours seen in the NUKEMAP. This model, obviously, doesn’t quite look like the complexities of real life, but as a rough indication of the type of radioactive contamination expected, and over what kind of area, it has its uses. The mathematical model is the sort that requires much more complicated wind parameters (such as the various wind speeds and sheers at different altitudes) and tries to do something that looks more “realistic.”

The mathematical models are harder to get ahold of (the government has a few of them, but they don’t release them to non-government types like me) and require more computational power (so instead of running in less than a second, they require several minutes even on a modern machine). If I had one, I would probably try to implement it, but I don’t totally regret using the scaling model. In terms of communicating both the general technical point about fallout, and in the fact that this is an idealized model, it does very well. I would prefer people to look at a model and have no illusions that it is, indeed, just a model, as opposed to some kind of simulation whose slickness might engender false confidence.

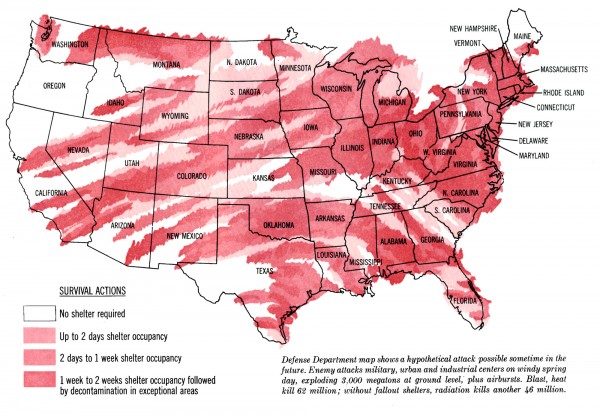
Fallout from a total nuclear exchange, in watercolors. From the Saturday Evening Post, March 23, 1963.

Fallout from a total nuclear exchange, in watercolors. From the Saturday Evening Post, March 23, 1963. Click to zoom.

Working on the fallout model, though, made me realize how little I really understood about nuclear fallout. I mean, my general understanding was still right, but I had a few subtle-but-important revelations that changed the way I thought about nuclear exchanges in general.

The most important one is that fallout is primary a product of surface bursts. That is, the chief determinant as to whether there is local fallout or not is whether the nuclear fireball touches the ground. Airbursts where the fireball doesn’t touch the ground don’t really produce fallout worth talking about — even if they are very large.

I read this in numerous fallout models and effects books and thought, can this be right? What’s the ground got to do with it? A whole lot, apparently. The nuclear fireball is full of highly-radioactive fission products. For airbursts, the cloud goes pretty much straight up and those particles are light enough and hot enough that they pretty much just hang out at the top of the cloud. By the time they start to cool and drag enough to “fall out” of the cloud, they have diffused themselves in the atmosphere and also decayed quite a bit. So they are basically not an issue for people on the ground — you end up with exposures in the tenths or hundreds of rads, which isn’t exactly nothing but is pretty low. This is more or less what they found at Hiroshima and Nagasaki — there were a few places where fallout had deposited, but it was extremely limited and very low radiation, as you’d expect with those two airbursts.

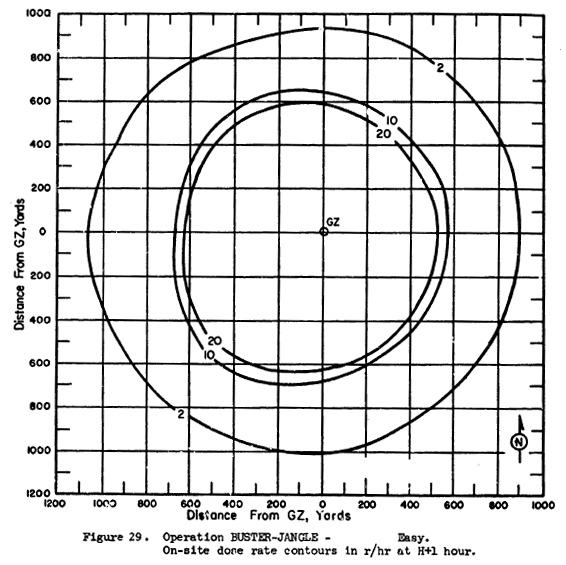
I thought this might be simplifying things a bit, so I looked up the fallout patterns for airbursts. And you know what? It seems to be correct. The radiation pattern you get from a “nominal” fission airburst looks more or less like this:

The on-side dose rate contours for the Buster-Jangle "Easy" shot (31 kilotons), in rads per hour. Notice that barely any radiation goes further than 1,100 yards from ground zero, and that even that is very low level (2 rads/hr).

The on-side dose rate contours for the Buster-Jangle “Easy” shot (31 kilotons), in rads per hour. Notice that barely any radiation goes further than 1,100 yards from ground zero, and that even that is very low level (2 rads/hr). Source.

That’s not zero radiation, but as you can see it is very, very local, and relatively limited. The radiation deposited is about the same range as the acute effects of the bomb itself, as opposed to something that affects people miles downwind.

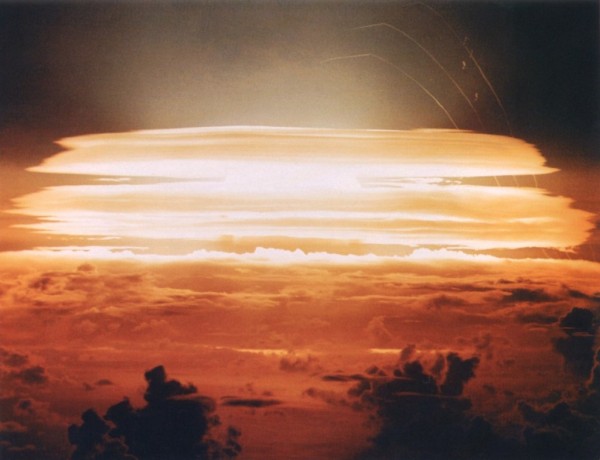
What about very large nuclear weapons? The only obvious US test that fit the bill here was Redwing Cherokee, from 1956. This was the first thermonuclear airdrop by the USA, and it had a total yield of 3.8 megatons — nothing to sniff at, and a fairly high percentage of it (at least 50%) from fission. But, sure enough, appears to have been basically no fallout pattern as a result. A survey meter some 100 miles from ground-zero picked up a two-hour peak of .25 millirems per hour some 10 hours later — which is really nothing to worry about. The final report on the test series concluded that Cherokee produced “no fallout of military significance” (all the more impressive given how “dirty” many of the other tests in that series were). Again, not truly zero radiation, but pretty close to it, and all the more impressive given the megatonnage involved.

Redwing Cherokee: big boom, but almost no fallout.

Redwing Cherokee: quite a big boom, but almost no fallout.

The case of the surface burst is really quite different. When the fireball touches the ground, it ends up mixing the fission products with dirt and debris. (Or, in the case of testing in the Marshall Islands, coral.) The dirt and debris breaks into fine chunks, but it is heavy. These heavier particles fall out of the cloud very quickly, starting at about an hour after detonation and then continuing for the next 96 hours or so. And as they fall out, they are both attached to the nasty fission products and have other induced radioactivity as well. This is the fallout we’re used to from the big H-bomb tests in the Pacific (multi-megaton surface bursts on coral atolls was the worst possible combination possible for fallout) and even the smaller surface bursts in Nevada.

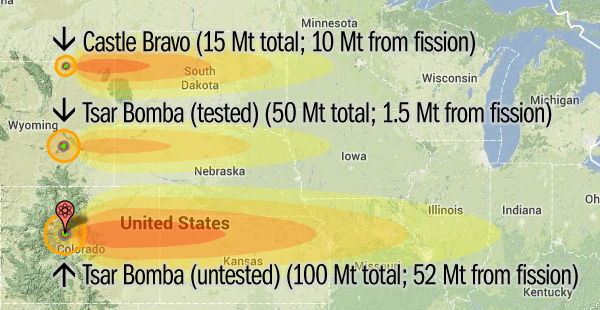
The other thing the new model helped me appreciate more is exactly how much the fission fraction matters. The fission fraction is the amount of the total yield that is derived from fission, as opposed to fusion. Fission is the only reaction that produces  highly-radioactive byproducts. Fusion reactions produce neutrons, which are a definite short-term threat, but not so much a long-term concern. Obviously all “atomic” or fission bombs have a fission fraction of 100%, but for thermonuclear weapons it can vary quite a bit. I’ve talked about this in a recent post, so I won’t go into detail here, but just emphasize that it was unintuitive to me that the 50 Mt Tsar Bomba, had it been a surface burst, would have had much less fallout than the 15 Mt Castle Bravo shot, because the latter had some 67% of its energy derived from fission while the former had only 3%. Playing with the NUKEMAP makes this fairly clear:

Fallout comparisons

The darkest orange here corresponds to 1,000 rads/hr (a deadly dose); the slightly darker orange is 100 rads/hr (an unsafe dose); the next lighter orange is 10 rads/hr (ill-advised), the lightest yellow is 1 rad/hr (not such a big deal). So the 50 Mt Tsar Bomba is entirely within the “unsafe” range, as compared to the large “deadly” areas of the other two. Background location chosen only for scale!

The real relevance of all of this for understanding nuclear war is fairly important. Weapons that are designed to flatten cities, perhaps surprisingly, don’t really pose as much of a long-term fallout hazard. The reason for this is that the ideal burst height for such a weapon is usually set to maximize the 10 psi pressure radius, and that is always fairly high above the ground. (The maximum radius for a pressure wave is somewhat unintuitive because it relies on how the wave will be reflected on the ground. So it doesn’t produce a straightforward curve.) Bad for the people in the cities themselves, to be sure, but not such a problem for those downwind.

But weapons that are designed to destroy command bunkers, or missiles in silos, are the worst for the surrounding civilian populations. This is because such weapons are designed to penetrate the ground, and the fireballs necessarily come into contact with the dirt and debris. As a result, they kick up the worst sort of fallout that can stretch many hundreds of miles downwind.

So it’s sort of a damned-if-you-do, damned-if-you-don’t sort of situation when it comes to nuclear targeting. If you try to do the humane thing by only targeting counterforce targets, you end up producing the worst sort of long-range, long-term radioactive hazard. The only way to avoid that is to target cities — which isn’t exactly humane either. (And, of course, the idealized terrorist nuclear weapon manages to combine the worst aspects of both: targeting civilians and kicking up a lot of fallout, for lack of a better delivery vehicle.)

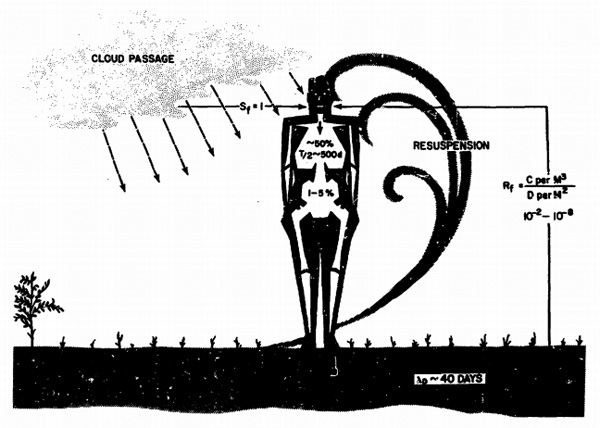
A rather wonderful 1970s fallout exposure diagram. Source.

A rather wonderful 1970s fallout exposure diagram. Source.

And it is worth noting: fallout mitigation is one of those areas were Civil Defense is worth paying attention to. You can’t avoid all contamination by staying in a fallout shelter for a few days, but you can avoid the worst, most acute aspects of it. This is what the Department of Homeland Security has been trying to convince people of, regarding a possible terrorist nuclear weapon. They estimate that hundreds of thousands of lives could be saved in such an event, if people understood fallout better and acted upon it. But the level of actual compliance with such recommendations (stay put, don’t flee immediately) seems like it would be rather low to me.

In some sense, this made me feel even worse about fallout than I had before. Prior to playing around with the details, I’d assumed that fallout was just a regular result of such weapons. But now I see it more as underscoring the damnable irony of the bomb: that all of the choices it offers up to you are bad ones.

Visions

The bomb and its makers

by Alex Wellerstein, published July 30th, 2013

In part of the “make this blog actually work again” campaign, I’ve changed some things on the backend which required me to change the blog url from http://nuclearsecrecy.com/blog/ to https://blog.nuclearsecrecy.com/. Fortunately, even if you don’t update your bookmarks, the old links should all still work automatically. It seems to be working a lot better at the moment — in the sense that I can once again edit the blog — so that’s something!


In all of the new NUKEMAP fuss, and the fact that my blog kept crashing, I didn’t get a chance to mention that I had two multimedia essays up on the website of The Bulletin of the Atomic Scientists. I’m pretty happy with both of these, both visually and in terms of the text.

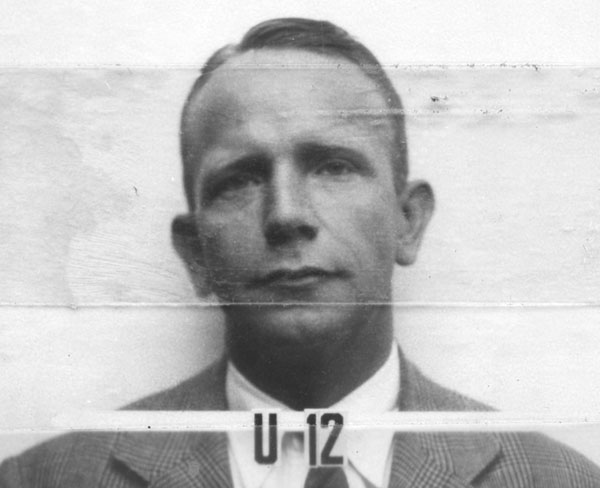
The first was published a few weeks ago, and was related to my much earlier post relating to the badge photographs at Los Alamos. The faces that made the Bomb has so far proved to be the one thing I’ve done that people end up bringing up in casual conversation without realizing I wrote it. (The scenario is, I meet someone new, I mention I work on the history of nuclear weapons, they ask me if I’ve seen this thing on the Internet about the badge photographs, I answer that I in fact wrote it, a slight awkwardness follows.)

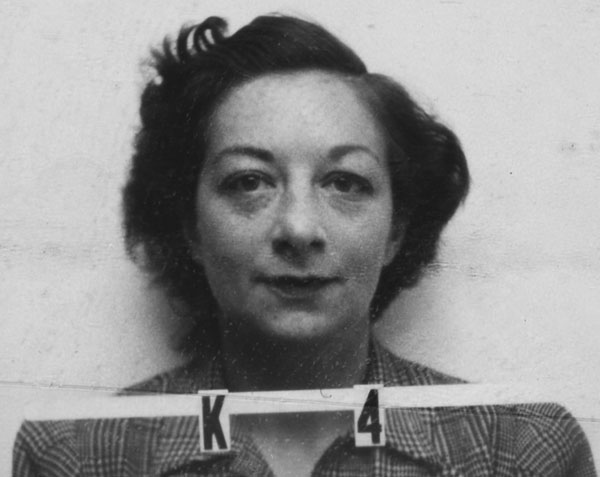
Charlotte_Serber

Some of the badge photographs are the ones that anyone on here would be familiar with — Oppenheimer, Groves, Fuchs, etc. But I enjoyed picking out a few more obscure characters. One of my favorites of these is Charlotte Serber, wife of the physicist and Oppenheimer student Robert Serber. Here’s my micro-essay:

Charlotte Serber was one of the many wives of the scientists who came to Los Alamos during the war. She was also one of the many wives who had their own substantial jobs while at the lab. While her husband, Robert Serber, worked on the design of the first nuclear weapons, Charlotte was the one in charge of running the technical library. While “librarian” might not at first glance seem vital to the war project, consider J. Robert Oppenheimer’s postwar letter to Serber, thanking her that “no single hour of delay has been attributed by any man in the laboratory to a malfunctioning, either in the Library or in the classified files. To this must be added the fact of the surprising success in controlling and accounting for the mass of classified information, where a single serious slip might not only have caused us the profoundest embarrassment but might have jeopardized the successful completion of our job.” Serber fell under unjustified suspicion of being a Communist in the immediate postwar, and, according to her FBI file, her phones were tapped. Who had singled her out as a possible Communist, because of her left-wing parents? Someone she thought of as a close personal friend: J. Robert Oppenheimer.

Charlotte was also the only woman Division Leader at Los Alamos, as the director of the library. She was also the only Division Leader barred from attending the Trinity test — on account of a lack of “facilities” for women there. She considered this a gross injustice.

What I like about Charlotte is not only that she highlights that many of the “Los Alamos wives” actually did work that was crucial to the project (and there were scientists amongst the “wives” as well, such as Elizabeth R. Graves, who I also profiled), and that the work of a librarian can be pretty vital (imagine if they didn’t have good organization of their reports, files, and classified information). But I also find Charlotte’s story amazing because of the betrayal: Oppenheimer the friend, Oppenheimer the snitch.

I should note that Oppenheimer’s labeling of Charlotte was probably not meant to be malicious — he was going over lists of people who might have Communist backgrounds when talking to the Manhattan Project security officers. He rattled off a number of names, and even said he thought most of them probably weren’t themselves Communists. This, of course, meant that they got flagged as possible Communists for the rest of their lives. Oppenheimer’s attempt to look loyal to the security system, even his attempts to be benign about it, were terrible failures in the long run, both for him and for his poor friends. Albert Einstein put it well: “The trouble with Oppenheimer is that he loves a woman who doesn’t love him—the United States government.”

Kenneth Bainbridge

The other one I want to highlight on here is that of Kenneth T. Bainbridge. Bainbridge was Harvard physicist and was in charge of organizing Project Trinity, the first test of the atomic bomb in July 1945. It was a big job — bigger, I think, than most people realize. You don’t just throw an atomic bomb on top of a tower in the desert and set it off. It had a pretty large staff, required a ton of theoretical and practical work, and, in the end, was an experiment that, ideally, destroyed itself in the process. Here was my Bainbridge blurb:

During the Manhattan Project, Harvard physicist Kenneth Bainbridge was in charge of setting up the Trinity test—afterward he became known as the person who famously said: “Now we are all sons of bitches.” Years later he wrote a letter to J. Robert Oppenheimer explaining his choice of words: “I was saying in effect that we had all worked hard to complete a weapon which would shorten the war but posterity would not consider that phase of it and would judge the effort as the creation of an unspeakable weapon by unfeeling people. I was also saying that the weapon was terrible and those who contributed to its development must share in any condemnation of it. Those who object to the language certainly could not have lived at Trinity for any length of time.” Oppenheimer’s reply to Bainbridge’s sentiments was simple: “We do not have to explain them to anyone.

I’ve had that Bainbridge/Oppenheimer exchange in my files for a long time, but never really had a great opportunity to put it into print. To flesh out the context a little more, it came out in the wake of Lansing Lamont’s popular book, Day of Trinity (1965). Bainbridge was one of the sources Lamont had talked to, and he gave him the “sons of bitches” quote. Oppenheimer’s full reply to Bainbridge took some digs at the book:

“When Lamont’s book on Trinity came, I first showed it to Kitty; and a moment later I heard her in the most unseemly laughter. She had found the preposterous piece about the ‘obscure lines from a sonnet of Baudelaire.’ But despite this, and all else that was wrong with it, the book was worth something to me because it recalled your words. I had not remembered them, but I did and do recall them. We do not have to explain them to anyone.”

The “obscure lines” was some kind of code supposedly sent by Oppenheimer to Kitty to say that the test worked. In Bainbridge’s files at the Harvard Archives there is quite a lot of material on the Lamont book from other Manhattan Project participants — most of them found a lot of fault with it on a factual basis, but admired its writing and presentation.

Bainbridge makes for a good segue into my other BAS multimedia essay, “The beginning of the Bomb,” which is about the Trinity test and which came out just before the 68th anniversary, which was two weeks ago. It also was somewhat of a reprise of themes I’d first played with on the blog, namely my post on “Trinity’s Cloud.” I’ve been struck that while Trinity was so extensively documented, the same few pictures of it and its explosion are re-used again and again. Basically, if it isn’t one of the “blobs of fire” pictures, or the Jack Aeby early-stage fireball/cloud photograph (the one used on the cover of The Making of the Atomic Bomb), then it doesn’t seem to exist. Among other things related to Trinity, I got to include two of my favorite alternative Trinity photographs.

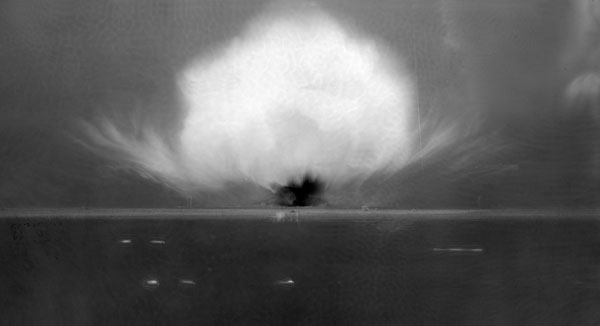
Trinity long exposure

The first is this ghostly apparition above. What a strange, occult thing the atomic bomb looks like in this view. While most photographs of the bomb are concerned about capturing it at a precise fraction of a second — a nice precursor to the famous Rapatronic photographs of the 1950s — this one does something quite different, and quite unusual. This is a long exposure photograph of several seconds of the explosion. The caption indicates (assuming I am interpreting it correctly) that it is an exposure of several seconds before the explosion and then two seconds after the beginning of the detonation. Which would explain why there are so many pre-blast details available to see.

The result is what you see here: a phantom whose resemblance to the “classic” Trinity explosion pictures is more evocative than definite. And if you view it at full size, you can just make out features of the desert floor: the cables that held up the tower, for example. (Along with some strange, blobby artifacts associated with dark room work.) I somewhat wish this was the image of “the atomic bomb” that we all had in our minds — dark, ghastly, tremendous. Instead of seeing just a moment after the atomic age began, we instead see in a single image the transition between one age and the next.

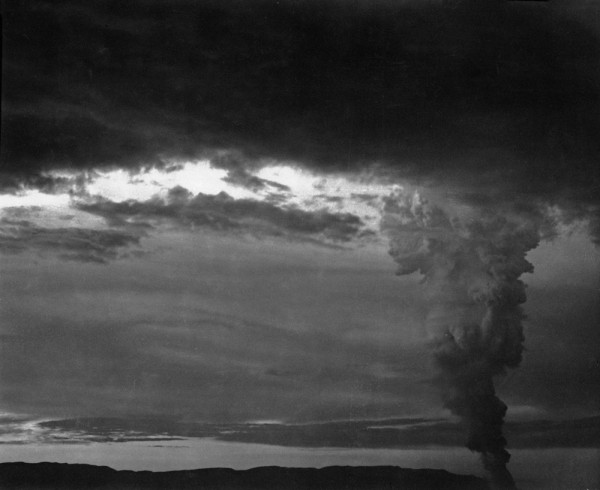
Trinity mushroom cloud

Most of the photographs of Trinity are of its first few seconds. But this one is not. It may be the only good photograph I have seen of the late-stage Trinity mushroom cloud. It is striking, is it not? A tall, dark column of smoke, lightly mushroomed at the top, with a larger cloud layer above it. “Ominous” is the word I keep coming back to, especially once you know that the cloud in question was highly radioactive.

One of the things I found while researching the behavior of mushroom clouds for the NUKEMAP3D was that while the mushroom cloud is an ubiquitous symbol of the bomb, it is specifically the early-stage mushroom cloud whose photograph gets shown repeatedly. Almost all nuclear detonation photographs are of the first 30 second or so of the explosion, when the mushroom cloud is still quite small, and usually quite bright and mushroomy. The late-stage cloud — about 4-10 minutes, depending on the yield of the bomb — is a much larger, darker, and unpleasant thing.

Why did we so quickly move from thinking of the atomic bomb as a burst of fire into a cloud of smoke? The obvious answer would be Hiroshima and Nagasaki, where we lacked the instrumentation to see the fireball, and only could see the cloud. But I’m still struck that our visions of these things are still so constrained to a few examples, a few moments in time, out of so many other possibilities, each with their own quite different visual associations.

News and Notes | Visions

The NUKEMAPs are here

by Alex Wellerstein, published July 25th, 2013

I’m super excited to announce that last Thursday, at an event hosted by the Center for Nonproliferation Studies at the Monterey Institute for International Study, I officially launched NUKEMAP2 and NUKEMAP3D. I gave a little talk, which I managed to record, but I haven’t had the time (more details below on why!) to get that up on YouTube yet. Soon, though.

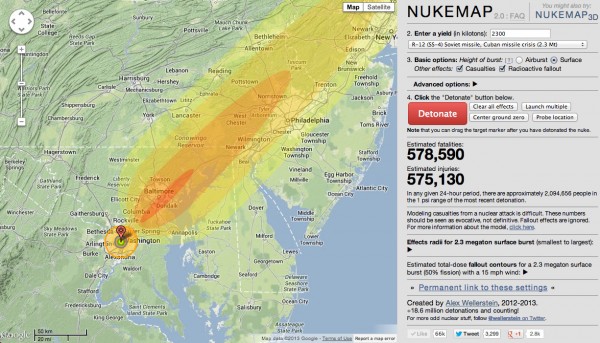
A Soviet weapon from the Cuban Missile Crisis, centered on Washington, DC, with fallout and casualties shown.

A Soviet weapon from the Cuban Missile Crisis, centered on Washington, DC, with fallout and casualties shown.

NUKEMAP2 is an upgraded version of the original NUKEMAP, with completely re-written effects simulations codes that allow one a huge amount of flexibility in the nuclear detonation one is trying to model. It also allows fallout mapping and casualty counts, among other things. I wanted to make it so that the NUKEMAP went well beyond any other nuclear mapping tools on the web — I wanted it to be a tool that both the layman and the wonk could use, a tool that rewarded exploration, and a tool that, despite the limitations of a 2D visualization, could work to deeply impress people with the power of a nuclear explosion.

The codes that underly the model are all taken from Cold War effects models. At some point, once it has been better documented than it is now, I’ll probably release the effects library I’ve written under an open license. I don’t think there’s anything quite like it out there at the moment available for the general public. For the curious, there are more details about the models and their sources here.

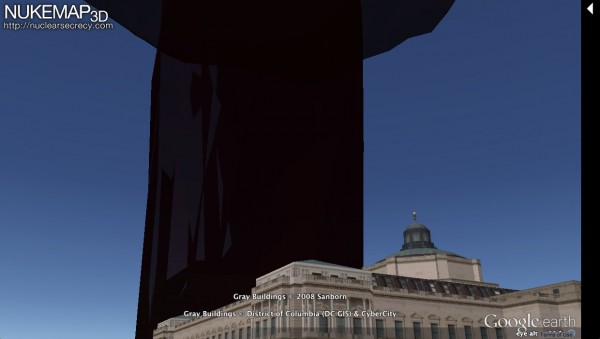
The mushroom cloud from a 20 kiloton detonation, centered on downtown DC, as viewed from one of my common stomping grounds, the Library of Congress.

The mushroom cloud from a 20 kiloton detonation, centered on downtown DC, as viewed from one of my common stomping grounds, the Library of Congress.

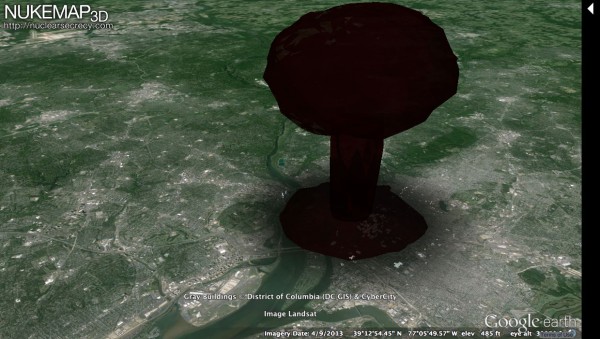
NUKEMAP3D uses Google Earth to allow “3D” renderings of mushroom clouds and the nuclear fireball. Now, for the first time, you can visualize what a mushroom cloud from a given yield might look like on any city in the world, viewed from any vantage-point you can imagine. I feel like it is safe to say that there has never been a nuclear visualization tool of quite this nature before.

I got the idea for NUKEMAP3D while looking into a story for the Atlantic on a rare photo of the Hiroshima mushroom cloud. One of the issues I was asked about was how long after the detonation the photograph was taken — the label on the back of the photograph said 30 minutes, but there was some doubt. In the process of looking into this, I started to dig around the literature on mushroom cloud formation and the height of the Hiroshima cloud at various time intervals. I realized that I had no sense for what “20,000 feet” meant in terms of a cloud, so I used Google Earth to model a simple 20,000 foot column above the modern-day city of Hiroshima.

I was stunned at the size of it, when viewed from that perspective — it was so much larger than it even looked in photographs, because the distance that such photographs were taken from makes it very hard to get a sense of scale. I realized that modeling these clouds in a 3D environment might really do something that a 2D model could not. It seems to switch on the part of the brain that judges sizes and areas in a way that a completely flat, top-down overlay does not. The fact that I was surprised and shocked by this, despite the fact that I look at pictures of mushroom clouds probably every day (hey, it’s my job!), indicated to me that this could be a really potent educational tool.

That same 20 kiloton cloud, as viewed from airplane height.

That same 20 kiloton cloud, as viewed from airplane height.

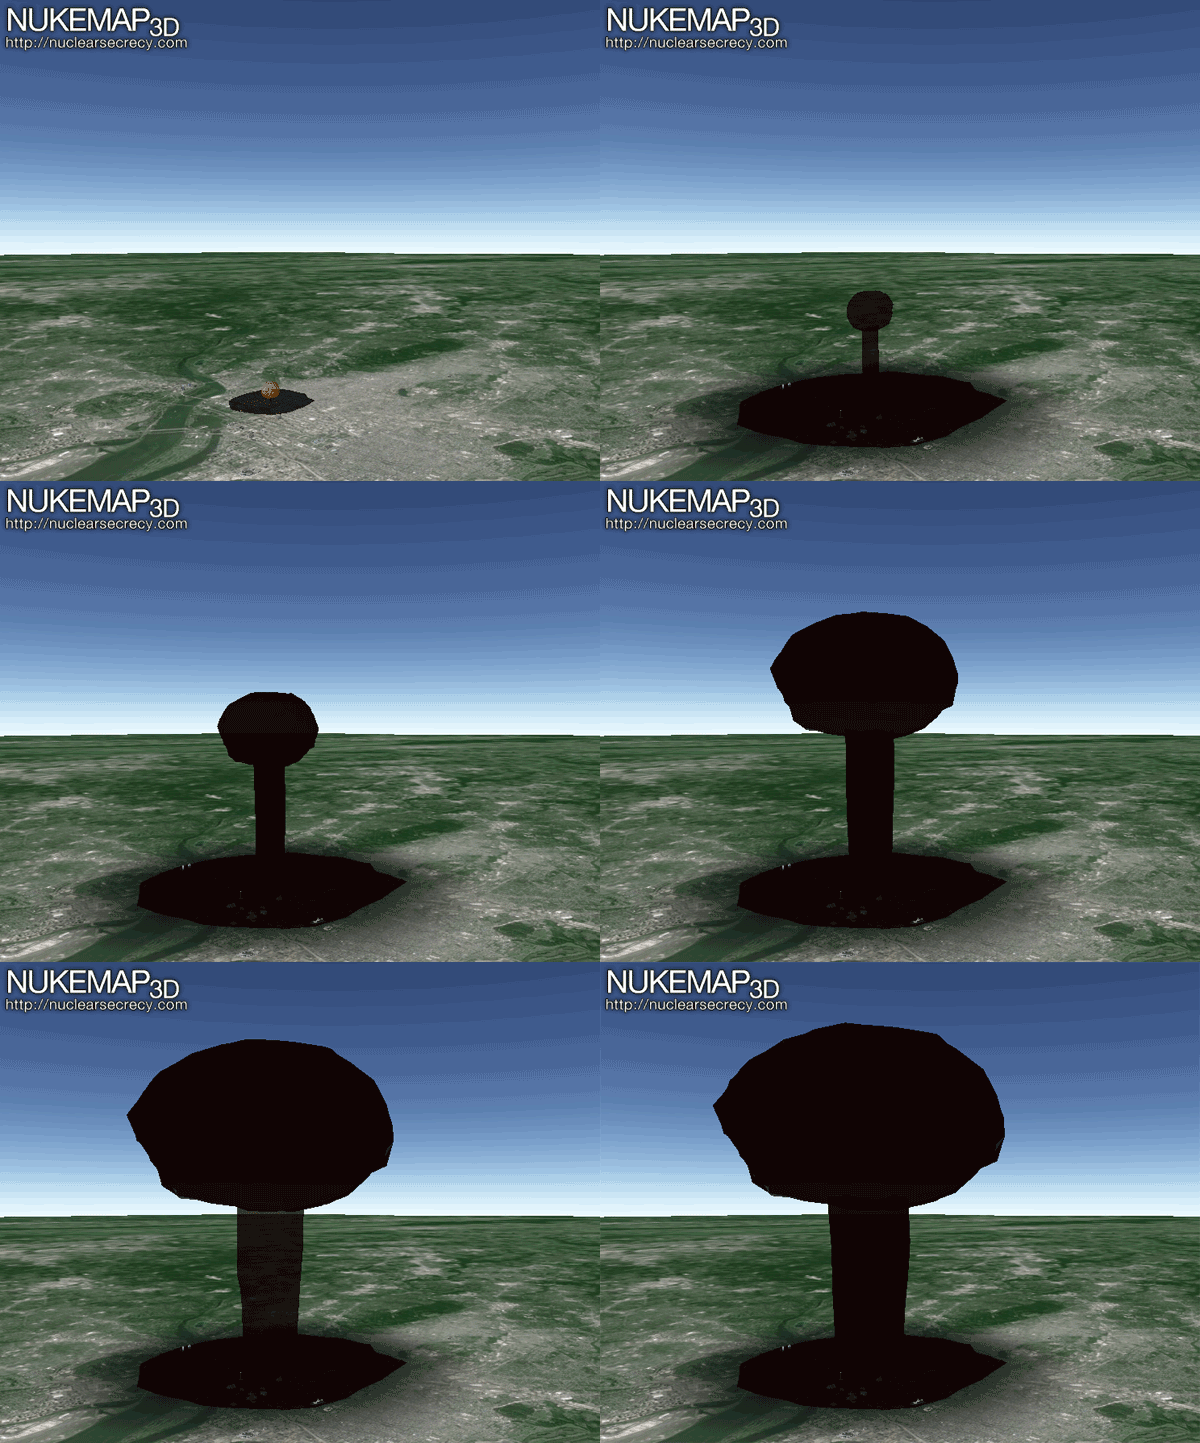
I’m also especially proud of the animated mode, which, if I’m allowed to say, was a huge pain in the neck to program. Even getting a somewhat “realistic”-looking cloud model was a nontrivial thing in Google Earth, because its modeling capabilities are somewhat limited, and because it isn’t really designed to let you manipulate models in a detailed way. It lets you scale model sizes along the three axes, it allows you to rotate them, and it allows you to change their position in 3D space. So I had to come up with ways of manipulating these models in realtime so that they would approximate a semi-realistic view of a nuclear explosion, given these limitations.

It’s obviously not quite as impressive as an actual nuclear explosion (but what is?), and my inability to use light as a real property (as you could in a “real” 3D modeling program) diminishes things a bit (that is, I can’t make it blinding, and I can’t make it cast shadows), but as a first go-around I think it is still a pretty good Google Earth hack. And presumably Google Earth, or similar tools, will only get better and more powerful in the future.

Screen captures of the animation for a 20 kt detonation over DC. These screenshots were taken in 10 second intervals, but are accelerated 100X here. The full animation takes about five minutes to run, which is roughly how the cloud would grow in real life.

Screen captures of the animation for a 20 kt detonation over DC. These screenshots were taken in 10 second intervals, but are accelerated 100X here. The full animation takes about five minutes to run, which is roughly how the cloud would grow in real life.

If you’ve been following my Twitter feed, you also probably have picked up that this has been a little bit of a saga. I tried to launch it on last Thursday night, but the population database wasn’t really working very well. The reason is that it is very, very large — underneath it is a population density map of the entire planet, in a 1km by 1km grid, and that means it is about 75 million records (thank goodness for the oceans!). Optimizing the queries helped a bit, and splitting the database up helped a bit. I then moved the whole database to another server altogether, just to make sure it wasn’t dragging down the rest of the server. But on Monday,just when the stories about NUKEMAP started to go up, my hosting company decided it was too much traffic and that I had, despite “unlimited bandwidth” promises, violated the Terms of Service by having a popular website (at that point it was doing nothing but serving up vanilla HTML, Javascript, and CSS files, so it wasn’t really a processing or database problem). Sigh. So I frantically worked to move everything to a different server, learned a lot about systems administration in the process, and then had the domain name issue a redirect from the old hosting company. And all of that ended up taking a few days to finalize (the domain name bit was frustratingly slow, due to settings chosen by the old hosting company).

But anyway. All’s well that ends well, right? Despite the technical problems, since moving the site to the new server, there have been over 1.2 million new “detonations” with the new NUKEMAPs, which is pretty high for one week of sporadic operation! 62% of them are with NUKEMAP3D, which is higher than I’d expected, given the computer requirements required to run the Google Earth plugin. The new server works well most of the time, so that’s a good thing, though there are probably some tweaks that still need to be done for it to happily run the blog and the NUKEMAPs. There is, though I don’t want to make it too intrusive or seem too irritating, a link now on the NUKEMAP for anyone who wanted to chip in to the server fund. Completely optional, and not expected, but if you did want to chip in, I can promise you a very friendly thank-you note at the very least.

Now that this is up and “done” for now, I’m hoping to get back to a regular blogging schedule. Until then, try out the new NUKEMAPs!

News and Notes

Presenting NUKEMAP2 and NUKEMAP3D

by Alex Wellerstein, published July 22nd, 2013

A longer post is coming later today, but in the meantime, I just wanted to make sure anyone on here knows that NUKEMAP2 and NUKEMAP3D are now online:

  • NUKEMAP2: sequel to the original NUKEMAP, with newly-derived effects equations and lots of brand-new options, including crater size, radioactive fallout plumes (with adjustable wind speeds and fission fractions!), and casualty counts! 
  • NUKEMAP3D: the next dimension of nuclear effects mapping, with 3D modeling and real-time animations of custom-built mushroom clouds and nuclear fireballs.
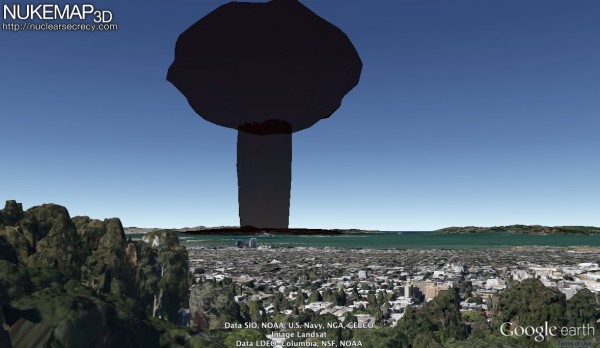
The mushroom cloud from a 20 kiloton explosion, centered on downtown San Francisco, as viewed from my old house in the Berkeley Hills. Estimated fatalities: 75,200.

The mushroom cloud from a 20 kiloton explosion, centered on downtown San Francisco, as viewed from my old house in the Berkeley Hills. Estimated fatalities: 75,200.

Technically the sites went live last Thursday, July 18, but there were some technical issues that took until the weekend to finalize (if they are, indeed, finalized) due to the heavy database usage of the new features (e.g. the casualty database). But I’ve moved things around a bit, optimized some sloppy queries, and now things seem to be doing pretty good despite being under a very heavy user load. More information soon!